Immigrants from Zaire vs Chickasaw Unemployment
COMPARE
Immigrants from Zaire
Chickasaw
Unemployment
Unemployment Comparison
Immigrants from Zaire
Chickasaw
5.2%
UNEMPLOYMENT
64.7/ 100
METRIC RATING
163rd/ 347
METRIC RANK
5.0%
UNEMPLOYMENT
94.0/ 100
METRIC RATING
103rd/ 347
METRIC RANK
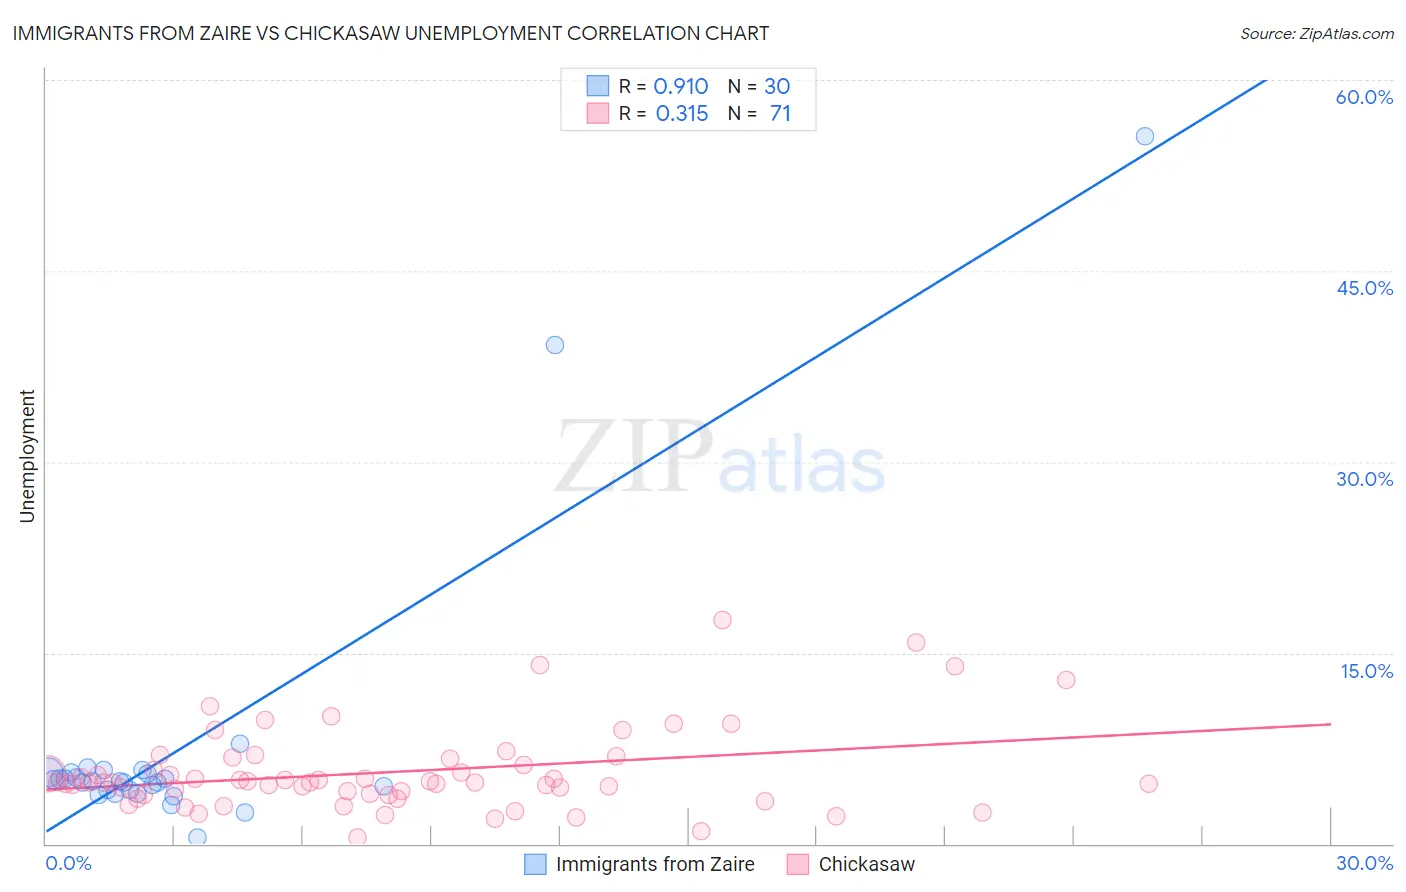
Immigrants from Zaire vs Chickasaw Unemployment Correlation Chart
The statistical analysis conducted on geographies consisting of 107,241,303 people shows a near-perfect positive correlation between the proportion of Immigrants from Zaire and unemployment in the United States with a correlation coefficient (R) of 0.910 and weighted average of 5.2%. Similarly, the statistical analysis conducted on geographies consisting of 147,562,181 people shows a mild positive correlation between the proportion of Chickasaw and unemployment in the United States with a correlation coefficient (R) of 0.315 and weighted average of 5.0%, a difference of 3.4%.
Unemployment Correlation Summary
| Measurement | Immigrants from Zaire | Chickasaw |
| Minimum | 0.50% | 0.50% |
| Maximum | 55.6% | 17.6% |
| Range | 55.1% | 17.1% |
| Mean | 7.5% | 5.6% |
| Median | 4.9% | 4.8% |
| Interquartile 25% (IQ1) | 4.2% | 3.8% |
| Interquartile 75% (IQ3) | 5.6% | 6.7% |
| Interquartile Range (IQR) | 1.4% | 2.9% |
| Standard Deviation (Sample) | 11.1% | 3.3% |
| Standard Deviation (Population) | 10.9% | 3.3% |
Similar Demographics by Unemployment
Demographics Similar to Immigrants from Zaire by Unemployment
In terms of unemployment, the demographic groups most similar to Immigrants from Zaire are Immigrants from Colombia (5.2%, a difference of 0.0%), Spanish (5.2%, a difference of 0.020%), Immigrants from Oceania (5.2%, a difference of 0.030%), Laotian (5.2%, a difference of 0.11%), and Immigrants from Brazil (5.2%, a difference of 0.11%).
| Demographics | Rating | Rank | Unemployment |
| Immigrants | Kazakhstan | 70.4 /100 | #156 | Good 5.2% |
| Sri Lankans | 69.5 /100 | #157 | Good 5.2% |
| Immigrants | Egypt | 66.7 /100 | #158 | Good 5.2% |
| Immigrants | Russia | 66.6 /100 | #159 | Good 5.2% |
| Laotians | 66.3 /100 | #160 | Good 5.2% |
| Immigrants | Oceania | 65.2 /100 | #161 | Good 5.2% |
| Spanish | 65.1 /100 | #162 | Good 5.2% |
| Immigrants | Zaire | 64.7 /100 | #163 | Good 5.2% |
| Immigrants | Colombia | 64.7 /100 | #164 | Good 5.2% |
| Immigrants | Brazil | 63.1 /100 | #165 | Good 5.2% |
| Immigrants | Indonesia | 61.2 /100 | #166 | Good 5.2% |
| Colombians | 61.1 /100 | #167 | Good 5.2% |
| Uruguayans | 60.2 /100 | #168 | Good 5.2% |
| Immigrants | Morocco | 59.1 /100 | #169 | Average 5.2% |
| Immigrants | Nicaragua | 57.1 /100 | #170 | Average 5.2% |
Demographics Similar to Chickasaw by Unemployment
In terms of unemployment, the demographic groups most similar to Chickasaw are Osage (5.0%, a difference of 0.0%), Maltese (5.0%, a difference of 0.0%), Immigrants from Argentina (5.0%, a difference of 0.040%), Immigrants from Romania (5.0%, a difference of 0.070%), and American (5.0%, a difference of 0.080%).
| Demographics | Rating | Rank | Unemployment |
| Immigrants | England | 95.2 /100 | #96 | Exceptional 5.0% |
| Immigrants | Czechoslovakia | 95.1 /100 | #97 | Exceptional 5.0% |
| Romanians | 95.0 /100 | #98 | Exceptional 5.0% |
| Mongolians | 94.8 /100 | #99 | Exceptional 5.0% |
| Estonians | 94.6 /100 | #100 | Exceptional 5.0% |
| Americans | 94.3 /100 | #101 | Exceptional 5.0% |
| Immigrants | Argentina | 94.1 /100 | #102 | Exceptional 5.0% |
| Chickasaw | 94.0 /100 | #103 | Exceptional 5.0% |
| Osage | 94.0 /100 | #104 | Exceptional 5.0% |
| Maltese | 94.0 /100 | #105 | Exceptional 5.0% |
| Immigrants | Romania | 93.7 /100 | #106 | Exceptional 5.0% |
| Immigrants | Turkey | 93.7 /100 | #107 | Exceptional 5.0% |
| Immigrants | Kuwait | 93.7 /100 | #108 | Exceptional 5.0% |
| Immigrants | Eritrea | 93.3 /100 | #109 | Exceptional 5.0% |
| Immigrants | Lithuania | 93.2 /100 | #110 | Exceptional 5.0% |