Zimbabwean vs Eastern European Unemployment
COMPARE
Zimbabwean
Eastern European
Unemployment
Unemployment Comparison
Zimbabweans
Eastern Europeans
4.8%
UNEMPLOYMENT
99.8/ 100
METRIC RATING
32nd/ 347
METRIC RANK
4.9%
UNEMPLOYMENT
99.2/ 100
METRIC RATING
54th/ 347
METRIC RANK
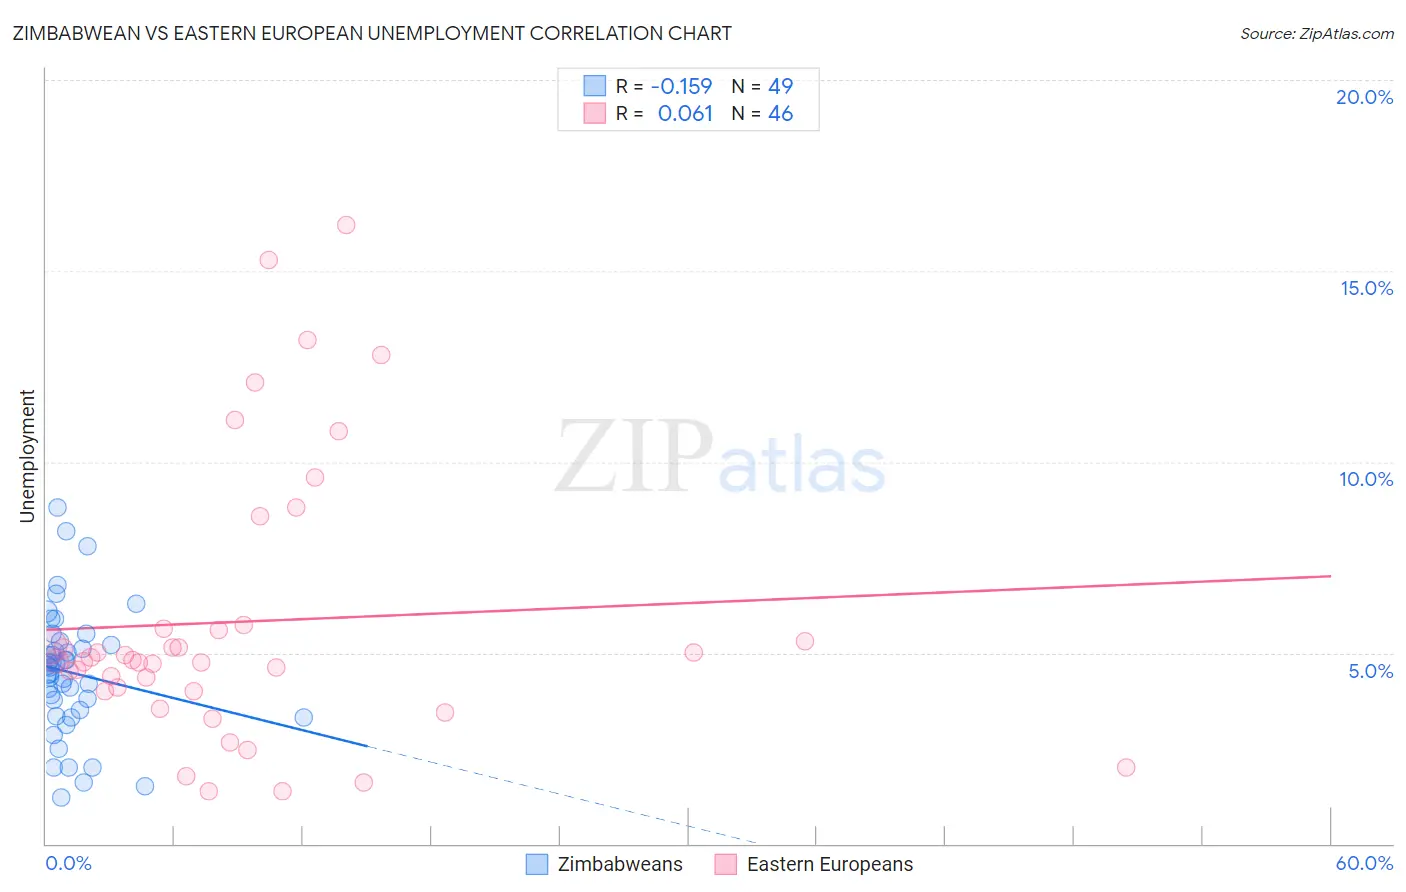
Zimbabwean vs Eastern European Unemployment Correlation Chart
The statistical analysis conducted on geographies consisting of 69,206,106 people shows a poor negative correlation between the proportion of Zimbabweans and unemployment in the United States with a correlation coefficient (R) of -0.159 and weighted average of 4.8%. Similarly, the statistical analysis conducted on geographies consisting of 460,325,858 people shows a slight positive correlation between the proportion of Eastern Europeans and unemployment in the United States with a correlation coefficient (R) of 0.061 and weighted average of 4.9%, a difference of 2.3%.
Unemployment Correlation Summary
| Measurement | Zimbabwean | Eastern European |
| Minimum | 1.2% | 1.4% |
| Maximum | 8.8% | 16.2% |
| Range | 7.6% | 14.8% |
| Mean | 4.5% | 5.8% |
| Median | 4.6% | 4.8% |
| Interquartile 25% (IQ1) | 3.4% | 4.0% |
| Interquartile 75% (IQ3) | 5.2% | 5.6% |
| Interquartile Range (IQR) | 1.8% | 1.6% |
| Standard Deviation (Sample) | 1.6% | 3.6% |
| Standard Deviation (Population) | 1.6% | 3.6% |
Similar Demographics by Unemployment
Demographics Similar to Zimbabweans by Unemployment
In terms of unemployment, the demographic groups most similar to Zimbabweans are Sudanese (4.8%, a difference of 0.010%), Immigrants from Bolivia (4.8%, a difference of 0.050%), Croatian (4.8%, a difference of 0.10%), Irish (4.8%, a difference of 0.12%), and Scotch-Irish (4.8%, a difference of 0.12%).
| Demographics | Rating | Rank | Unemployment |
| Latvians | 99.9 /100 | #25 | Exceptional 4.7% |
| Bulgarians | 99.9 /100 | #26 | Exceptional 4.7% |
| Finns | 99.9 /100 | #27 | Exceptional 4.7% |
| Cubans | 99.8 /100 | #28 | Exceptional 4.7% |
| Poles | 99.8 /100 | #29 | Exceptional 4.7% |
| Irish | 99.8 /100 | #30 | Exceptional 4.8% |
| Croatians | 99.8 /100 | #31 | Exceptional 4.8% |
| Zimbabweans | 99.8 /100 | #32 | Exceptional 4.8% |
| Sudanese | 99.8 /100 | #33 | Exceptional 4.8% |
| Immigrants | Bolivia | 99.8 /100 | #34 | Exceptional 4.8% |
| Scotch-Irish | 99.8 /100 | #35 | Exceptional 4.8% |
| Tongans | 99.7 /100 | #36 | Exceptional 4.8% |
| Czechoslovakians | 99.7 /100 | #37 | Exceptional 4.8% |
| Bolivians | 99.7 /100 | #38 | Exceptional 4.8% |
| Lithuanians | 99.7 /100 | #39 | Exceptional 4.8% |
Demographics Similar to Eastern Europeans by Unemployment
In terms of unemployment, the demographic groups most similar to Eastern Europeans are Immigrants from Zimbabwe (4.9%, a difference of 0.030%), Australian (4.9%, a difference of 0.030%), White/Caucasian (4.9%, a difference of 0.060%), Immigrants from Belgium (4.9%, a difference of 0.070%), and Celtic (4.9%, a difference of 0.19%).
| Demographics | Rating | Rank | Unemployment |
| Immigrants | Taiwan | 99.4 /100 | #47 | Exceptional 4.8% |
| Immigrants | Scotland | 99.3 /100 | #48 | Exceptional 4.9% |
| Immigrants | South Central Asia | 99.3 /100 | #49 | Exceptional 4.9% |
| French Canadians | 99.3 /100 | #50 | Exceptional 4.9% |
| Immigrants | Belgium | 99.2 /100 | #51 | Exceptional 4.9% |
| Whites/Caucasians | 99.2 /100 | #52 | Exceptional 4.9% |
| Immigrants | Zimbabwe | 99.2 /100 | #53 | Exceptional 4.9% |
| Eastern Europeans | 99.2 /100 | #54 | Exceptional 4.9% |
| Australians | 99.2 /100 | #55 | Exceptional 4.9% |
| Celtics | 99.1 /100 | #56 | Exceptional 4.9% |
| Immigrants | Singapore | 99.1 /100 | #57 | Exceptional 4.9% |
| Greeks | 99.0 /100 | #58 | Exceptional 4.9% |
| Bhutanese | 99.0 /100 | #59 | Exceptional 4.9% |
| Immigrants | Netherlands | 99.0 /100 | #60 | Exceptional 4.9% |
| Cambodians | 99.0 /100 | #61 | Exceptional 4.9% |