German vs Eastern European Unemployment
COMPARE
German
Eastern European
Unemployment
Unemployment Comparison
Germans
Eastern Europeans
4.5%
UNEMPLOYMENT
100.0/ 100
METRIC RATING
6th/ 347
METRIC RANK
4.9%
UNEMPLOYMENT
99.2/ 100
METRIC RATING
54th/ 347
METRIC RANK
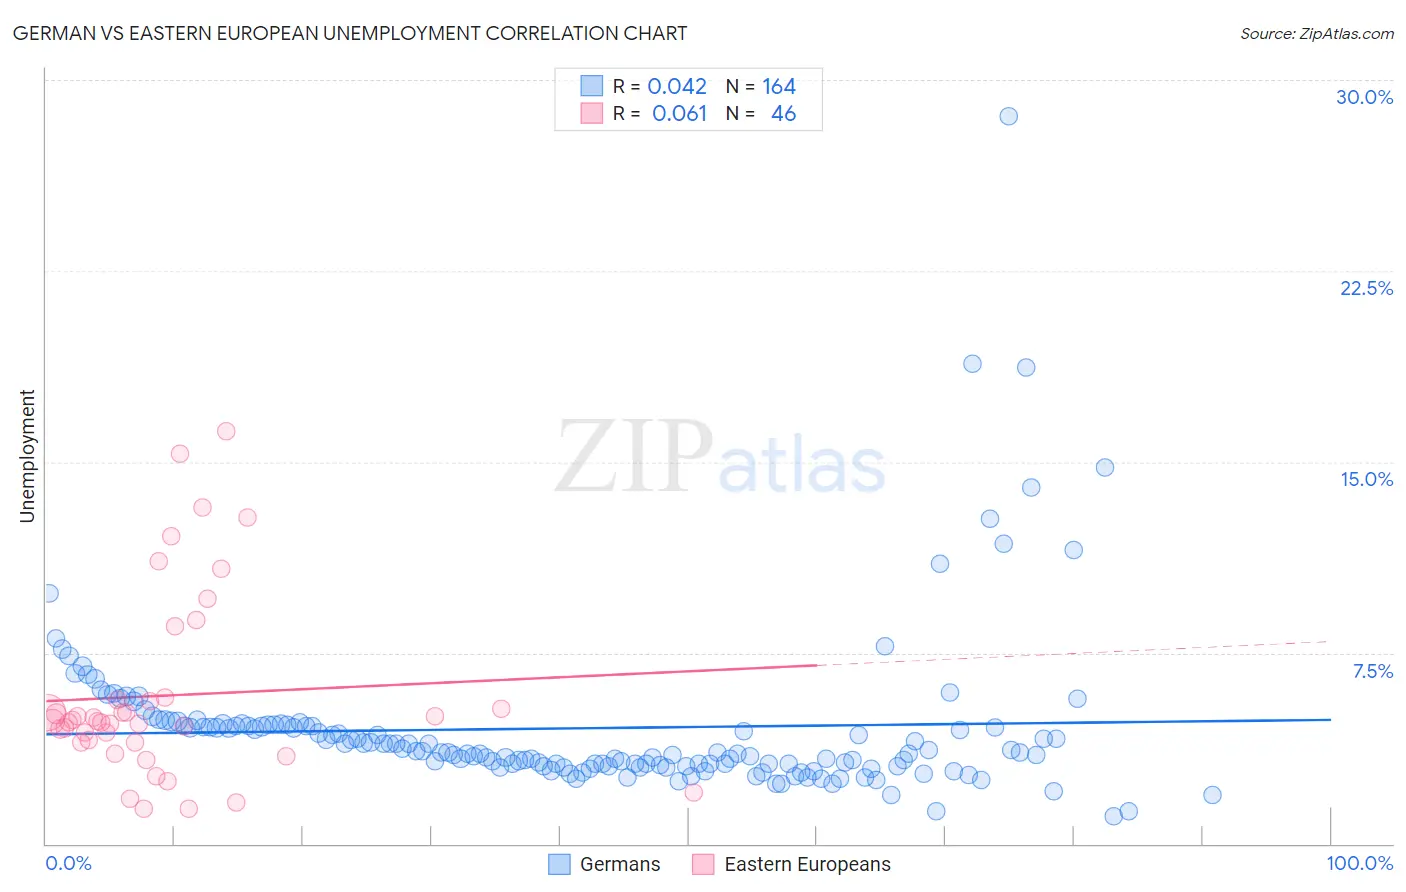
German vs Eastern European Unemployment Correlation Chart
The statistical analysis conducted on geographies consisting of 575,448,590 people shows no correlation between the proportion of Germans and unemployment in the United States with a correlation coefficient (R) of 0.042 and weighted average of 4.5%. Similarly, the statistical analysis conducted on geographies consisting of 460,325,858 people shows a slight positive correlation between the proportion of Eastern Europeans and unemployment in the United States with a correlation coefficient (R) of 0.061 and weighted average of 4.9%, a difference of 8.6%.
Unemployment Correlation Summary
| Measurement | German | Eastern European |
| Minimum | 1.1% | 1.4% |
| Maximum | 28.6% | 16.2% |
| Range | 27.5% | 14.8% |
| Mean | 4.5% | 5.8% |
| Median | 3.6% | 4.8% |
| Interquartile 25% (IQ1) | 3.1% | 4.0% |
| Interquartile 75% (IQ3) | 4.6% | 5.6% |
| Interquartile Range (IQR) | 1.6% | 1.6% |
| Standard Deviation (Sample) | 3.3% | 3.6% |
| Standard Deviation (Population) | 3.2% | 3.6% |
Similar Demographics by Unemployment
Demographics Similar to Germans by Unemployment
In terms of unemployment, the demographic groups most similar to Germans are Immigrants from India (4.5%, a difference of 0.55%), Swedish (4.4%, a difference of 0.79%), Swiss (4.5%, a difference of 1.0%), Scandinavian (4.5%, a difference of 1.4%), and Dutch (4.6%, a difference of 1.9%).
| Demographics | Rating | Rank | Unemployment |
| Norwegians | 100.0 /100 | #1 | Exceptional 4.2% |
| Luxembourgers | 100.0 /100 | #2 | Exceptional 4.3% |
| Czechs | 100.0 /100 | #3 | Exceptional 4.3% |
| Danes | 100.0 /100 | #4 | Exceptional 4.3% |
| Swedes | 100.0 /100 | #5 | Exceptional 4.4% |
| Germans | 100.0 /100 | #6 | Exceptional 4.5% |
| Immigrants | India | 100.0 /100 | #7 | Exceptional 4.5% |
| Swiss | 100.0 /100 | #8 | Exceptional 4.5% |
| Scandinavians | 100.0 /100 | #9 | Exceptional 4.5% |
| Dutch | 100.0 /100 | #10 | Exceptional 4.6% |
| English | 100.0 /100 | #11 | Exceptional 4.6% |
| Pennsylvania Germans | 100.0 /100 | #12 | Exceptional 4.6% |
| Belgians | 100.0 /100 | #13 | Exceptional 4.6% |
| Immigrants | Cuba | 100.0 /100 | #14 | Exceptional 4.6% |
| Europeans | 99.9 /100 | #15 | Exceptional 4.6% |
Demographics Similar to Eastern Europeans by Unemployment
In terms of unemployment, the demographic groups most similar to Eastern Europeans are Immigrants from Zimbabwe (4.9%, a difference of 0.030%), Australian (4.9%, a difference of 0.030%), White/Caucasian (4.9%, a difference of 0.060%), Immigrants from Belgium (4.9%, a difference of 0.070%), and Celtic (4.9%, a difference of 0.19%).
| Demographics | Rating | Rank | Unemployment |
| Immigrants | Taiwan | 99.4 /100 | #47 | Exceptional 4.8% |
| Immigrants | Scotland | 99.3 /100 | #48 | Exceptional 4.9% |
| Immigrants | South Central Asia | 99.3 /100 | #49 | Exceptional 4.9% |
| French Canadians | 99.3 /100 | #50 | Exceptional 4.9% |
| Immigrants | Belgium | 99.2 /100 | #51 | Exceptional 4.9% |
| Whites/Caucasians | 99.2 /100 | #52 | Exceptional 4.9% |
| Immigrants | Zimbabwe | 99.2 /100 | #53 | Exceptional 4.9% |
| Eastern Europeans | 99.2 /100 | #54 | Exceptional 4.9% |
| Australians | 99.2 /100 | #55 | Exceptional 4.9% |
| Celtics | 99.1 /100 | #56 | Exceptional 4.9% |
| Immigrants | Singapore | 99.1 /100 | #57 | Exceptional 4.9% |
| Greeks | 99.0 /100 | #58 | Exceptional 4.9% |
| Bhutanese | 99.0 /100 | #59 | Exceptional 4.9% |
| Immigrants | Netherlands | 99.0 /100 | #60 | Exceptional 4.9% |
| Cambodians | 99.0 /100 | #61 | Exceptional 4.9% |