Aleut vs Eastern European Unemployment
COMPARE
Aleut
Eastern European
Unemployment
Unemployment Comparison
Aleuts
Eastern Europeans
6.1%
UNEMPLOYMENT
0.0/ 100
METRIC RATING
284th/ 347
METRIC RANK
4.9%
UNEMPLOYMENT
99.2/ 100
METRIC RATING
54th/ 347
METRIC RANK
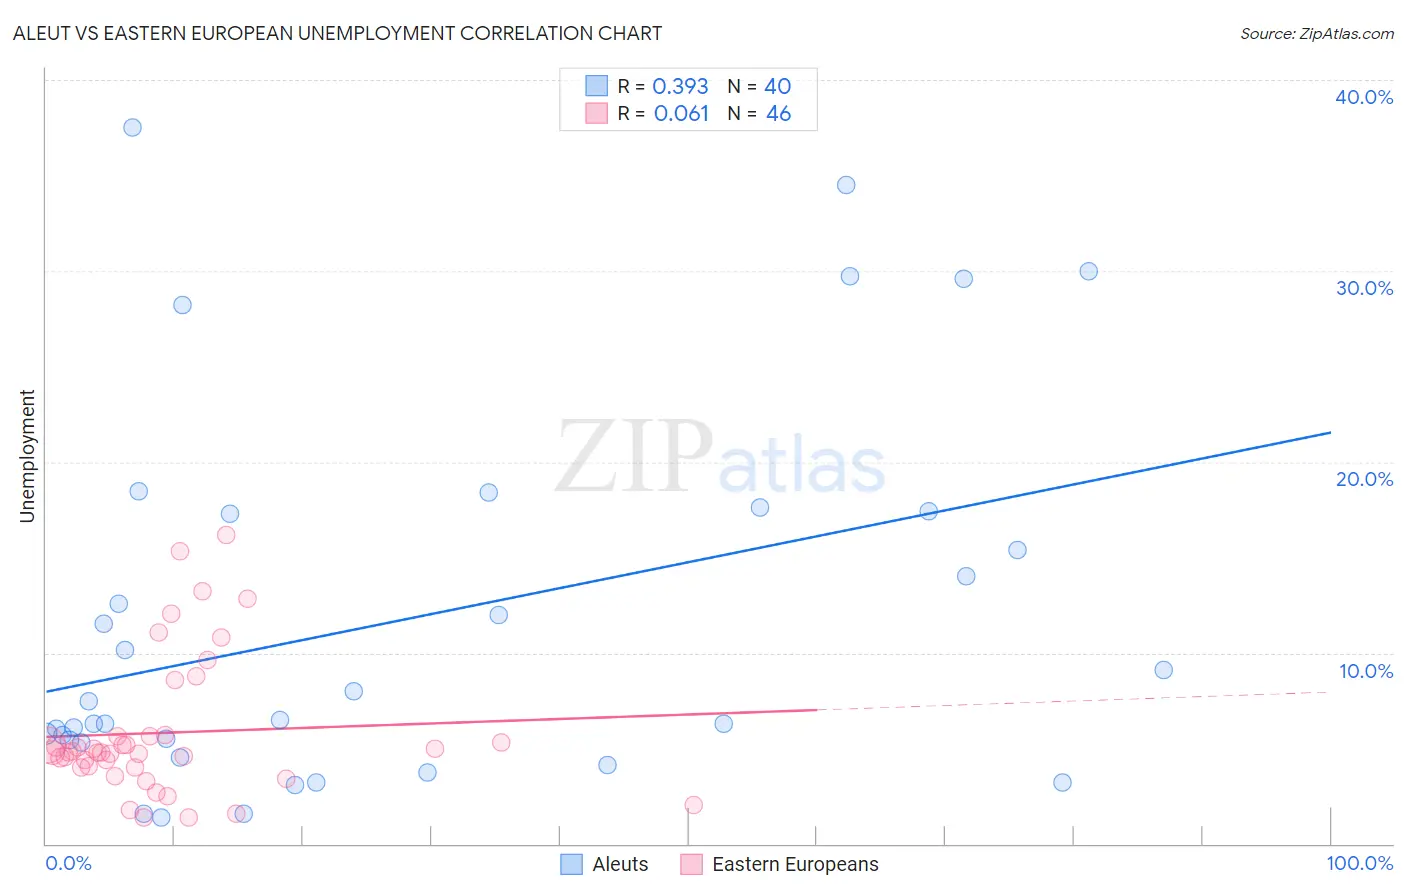
Aleut vs Eastern European Unemployment Correlation Chart
The statistical analysis conducted on geographies consisting of 61,764,375 people shows a mild positive correlation between the proportion of Aleuts and unemployment in the United States with a correlation coefficient (R) of 0.393 and weighted average of 6.1%. Similarly, the statistical analysis conducted on geographies consisting of 460,325,858 people shows a slight positive correlation between the proportion of Eastern Europeans and unemployment in the United States with a correlation coefficient (R) of 0.061 and weighted average of 4.9%, a difference of 24.7%.
Unemployment Correlation Summary
| Measurement | Aleut | Eastern European |
| Minimum | 1.4% | 1.4% |
| Maximum | 37.5% | 16.2% |
| Range | 36.1% | 14.8% |
| Mean | 11.8% | 5.8% |
| Median | 7.0% | 4.8% |
| Interquartile 25% (IQ1) | 5.4% | 4.0% |
| Interquartile 75% (IQ3) | 17.4% | 5.6% |
| Interquartile Range (IQR) | 12.0% | 1.6% |
| Standard Deviation (Sample) | 9.8% | 3.6% |
| Standard Deviation (Population) | 9.7% | 3.6% |
Similar Demographics by Unemployment
Demographics Similar to Aleuts by Unemployment
In terms of unemployment, the demographic groups most similar to Aleuts are Immigrants from Ghana (6.1%, a difference of 0.13%), Immigrants from the Azores (6.1%, a difference of 0.21%), African (6.1%, a difference of 0.28%), Immigrants from Mexico (6.0%, a difference of 0.86%), and Immigrants from Western Africa (6.0%, a difference of 0.86%).
| Demographics | Rating | Rank | Unemployment |
| Armenians | 0.0 /100 | #277 | Tragic 6.0% |
| Ghanaians | 0.0 /100 | #278 | Tragic 6.0% |
| Immigrants | Mexico | 0.0 /100 | #279 | Tragic 6.0% |
| Immigrants | Western Africa | 0.0 /100 | #280 | Tragic 6.0% |
| Africans | 0.0 /100 | #281 | Tragic 6.1% |
| Immigrants | Azores | 0.0 /100 | #282 | Tragic 6.1% |
| Immigrants | Ghana | 0.0 /100 | #283 | Tragic 6.1% |
| Aleuts | 0.0 /100 | #284 | Tragic 6.1% |
| Immigrants | Senegal | 0.0 /100 | #285 | Tragic 6.1% |
| Immigrants | Caribbean | 0.0 /100 | #286 | Tragic 6.2% |
| Nepalese | 0.0 /100 | #287 | Tragic 6.2% |
| Ecuadorians | 0.0 /100 | #288 | Tragic 6.2% |
| Chippewa | 0.0 /100 | #289 | Tragic 6.2% |
| Senegalese | 0.0 /100 | #290 | Tragic 6.2% |
| Haitians | 0.0 /100 | #291 | Tragic 6.2% |
Demographics Similar to Eastern Europeans by Unemployment
In terms of unemployment, the demographic groups most similar to Eastern Europeans are Immigrants from Zimbabwe (4.9%, a difference of 0.030%), Australian (4.9%, a difference of 0.030%), White/Caucasian (4.9%, a difference of 0.060%), Immigrants from Belgium (4.9%, a difference of 0.070%), and Celtic (4.9%, a difference of 0.19%).
| Demographics | Rating | Rank | Unemployment |
| Immigrants | Taiwan | 99.4 /100 | #47 | Exceptional 4.8% |
| Immigrants | Scotland | 99.3 /100 | #48 | Exceptional 4.9% |
| Immigrants | South Central Asia | 99.3 /100 | #49 | Exceptional 4.9% |
| French Canadians | 99.3 /100 | #50 | Exceptional 4.9% |
| Immigrants | Belgium | 99.2 /100 | #51 | Exceptional 4.9% |
| Whites/Caucasians | 99.2 /100 | #52 | Exceptional 4.9% |
| Immigrants | Zimbabwe | 99.2 /100 | #53 | Exceptional 4.9% |
| Eastern Europeans | 99.2 /100 | #54 | Exceptional 4.9% |
| Australians | 99.2 /100 | #55 | Exceptional 4.9% |
| Celtics | 99.1 /100 | #56 | Exceptional 4.9% |
| Immigrants | Singapore | 99.1 /100 | #57 | Exceptional 4.9% |
| Greeks | 99.0 /100 | #58 | Exceptional 4.9% |
| Bhutanese | 99.0 /100 | #59 | Exceptional 4.9% |
| Immigrants | Netherlands | 99.0 /100 | #60 | Exceptional 4.9% |
| Cambodians | 99.0 /100 | #61 | Exceptional 4.9% |