Immigrants from Barbados vs Belizean GED/Equivalency
COMPARE
Immigrants from Barbados
Belizean
GED/Equivalency
GED/Equivalency Comparison
Immigrants from Barbados
Belizeans
82.4%
GED/EQUIVALENCY
0.1/ 100
METRIC RATING
284th/ 347
METRIC RANK
80.9%
GED/EQUIVALENCY
0.0/ 100
METRIC RATING
314th/ 347
METRIC RANK
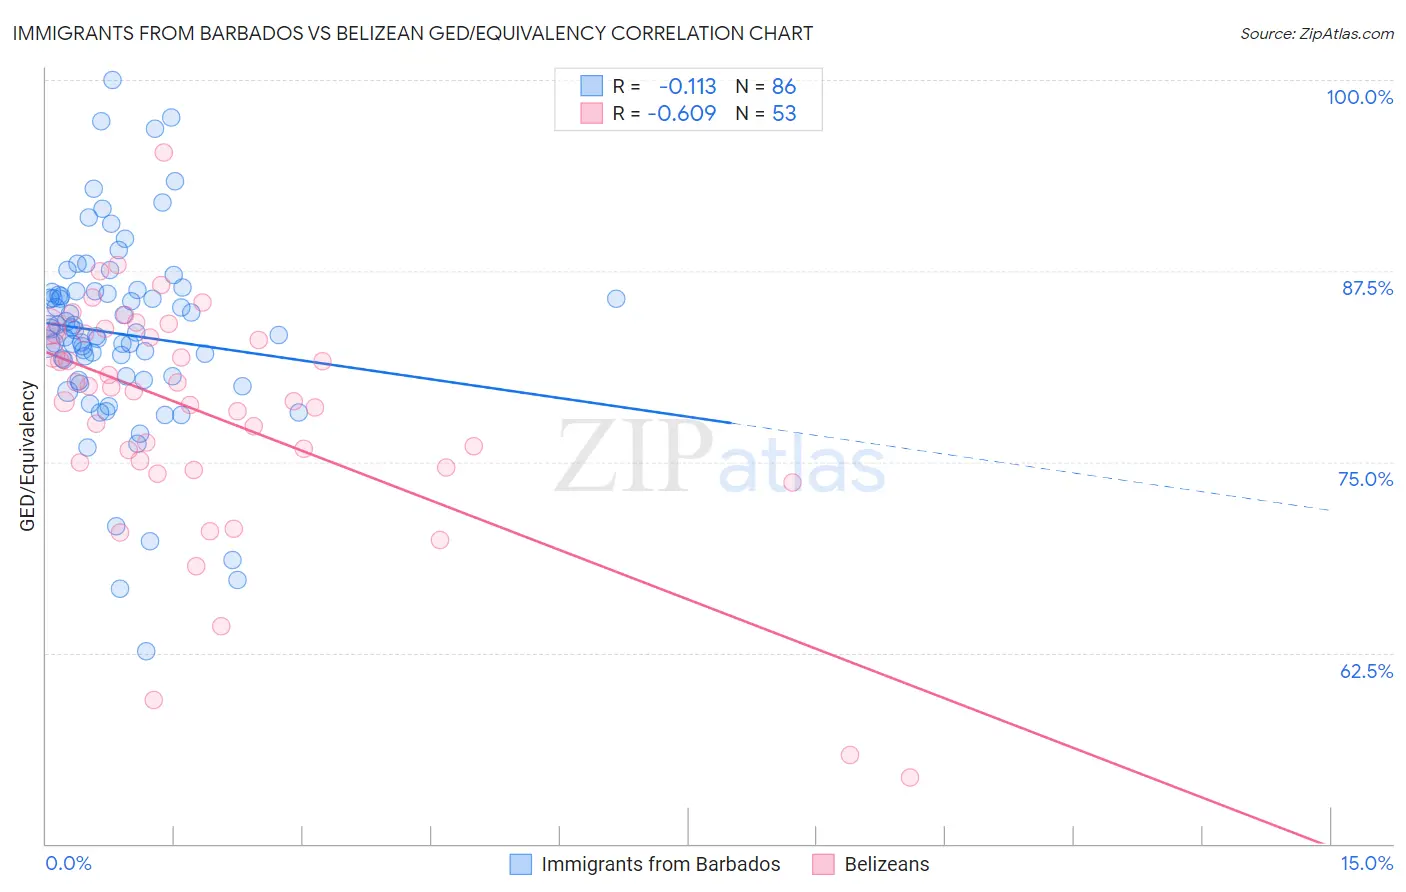
Immigrants from Barbados vs Belizean GED/Equivalency Correlation Chart
The statistical analysis conducted on geographies consisting of 112,783,324 people shows a poor negative correlation between the proportion of Immigrants from Barbados and percentage of population with at least ged/equivalency education in the United States with a correlation coefficient (R) of -0.113 and weighted average of 82.4%. Similarly, the statistical analysis conducted on geographies consisting of 144,224,111 people shows a significant negative correlation between the proportion of Belizeans and percentage of population with at least ged/equivalency education in the United States with a correlation coefficient (R) of -0.609 and weighted average of 80.9%, a difference of 1.9%.
GED/Equivalency Correlation Summary
| Measurement | Immigrants from Barbados | Belizean |
| Minimum | 62.6% | 54.3% |
| Maximum | 100.0% | 95.3% |
| Range | 37.4% | 40.9% |
| Mean | 83.4% | 78.1% |
| Median | 83.5% | 79.6% |
| Interquartile 25% (IQ1) | 80.6% | 74.8% |
| Interquartile 75% (IQ3) | 86.1% | 83.4% |
| Interquartile Range (IQR) | 5.5% | 8.6% |
| Standard Deviation (Sample) | 6.4% | 7.8% |
| Standard Deviation (Population) | 6.4% | 7.7% |
Similar Demographics by GED/Equivalency
Demographics Similar to Immigrants from Barbados by GED/Equivalency
In terms of ged/equivalency, the demographic groups most similar to Immigrants from Barbados are Cajun (82.4%, a difference of 0.030%), Immigrants from West Indies (82.4%, a difference of 0.060%), Japanese (82.4%, a difference of 0.070%), Indonesian (82.5%, a difference of 0.12%), and Immigrants (82.6%, a difference of 0.16%).
| Demographics | Rating | Rank | GED/Equivalency |
| Arapaho | 0.1 /100 | #277 | Tragic 82.8% |
| Immigrants | Laos | 0.1 /100 | #278 | Tragic 82.7% |
| Immigrants | Fiji | 0.1 /100 | #279 | Tragic 82.7% |
| Cheyenne | 0.1 /100 | #280 | Tragic 82.7% |
| Sioux | 0.1 /100 | #281 | Tragic 82.6% |
| Immigrants | Immigrants | 0.1 /100 | #282 | Tragic 82.6% |
| Indonesians | 0.1 /100 | #283 | Tragic 82.5% |
| Immigrants | Barbados | 0.1 /100 | #284 | Tragic 82.4% |
| Cajuns | 0.0 /100 | #285 | Tragic 82.4% |
| Immigrants | West Indies | 0.0 /100 | #286 | Tragic 82.4% |
| Japanese | 0.0 /100 | #287 | Tragic 82.4% |
| Pueblo | 0.0 /100 | #288 | Tragic 82.3% |
| Immigrants | Cambodia | 0.0 /100 | #289 | Tragic 82.2% |
| Haitians | 0.0 /100 | #290 | Tragic 82.1% |
| Cubans | 0.0 /100 | #291 | Tragic 82.0% |
Demographics Similar to Belizeans by GED/Equivalency
In terms of ged/equivalency, the demographic groups most similar to Belizeans are Nicaraguan (80.9%, a difference of 0.020%), Cape Verdean (80.9%, a difference of 0.020%), Immigrants from Guyana (81.0%, a difference of 0.060%), Native/Alaskan (80.9%, a difference of 0.060%), and Immigrants from Ecuador (81.0%, a difference of 0.13%).
| Demographics | Rating | Rank | GED/Equivalency |
| Immigrants | Dominica | 0.0 /100 | #307 | Tragic 81.1% |
| Puerto Ricans | 0.0 /100 | #308 | Tragic 81.1% |
| Immigrants | Ecuador | 0.0 /100 | #309 | Tragic 81.0% |
| Immigrants | Guyana | 0.0 /100 | #310 | Tragic 81.0% |
| Natives/Alaskans | 0.0 /100 | #311 | Tragic 80.9% |
| Nicaraguans | 0.0 /100 | #312 | Tragic 80.9% |
| Cape Verdeans | 0.0 /100 | #313 | Tragic 80.9% |
| Belizeans | 0.0 /100 | #314 | Tragic 80.9% |
| Apache | 0.0 /100 | #315 | Tragic 80.7% |
| Central American Indians | 0.0 /100 | #316 | Tragic 80.6% |
| Immigrants | Caribbean | 0.0 /100 | #317 | Tragic 80.5% |
| Yaqui | 0.0 /100 | #318 | Tragic 80.5% |
| Immigrants | Belize | 0.0 /100 | #319 | Tragic 80.5% |
| Immigrants | Cuba | 0.0 /100 | #320 | Tragic 80.2% |
| Yup'ik | 0.0 /100 | #321 | Tragic 80.0% |