Korean vs Belizean Unemployment
COMPARE
Korean
Belizean
Unemployment
Unemployment Comparison
Koreans
Belizeans
5.3%
UNEMPLOYMENT
27.4/ 100
METRIC RATING
200th/ 347
METRIC RANK
6.4%
UNEMPLOYMENT
0.0/ 100
METRIC RATING
303rd/ 347
METRIC RANK
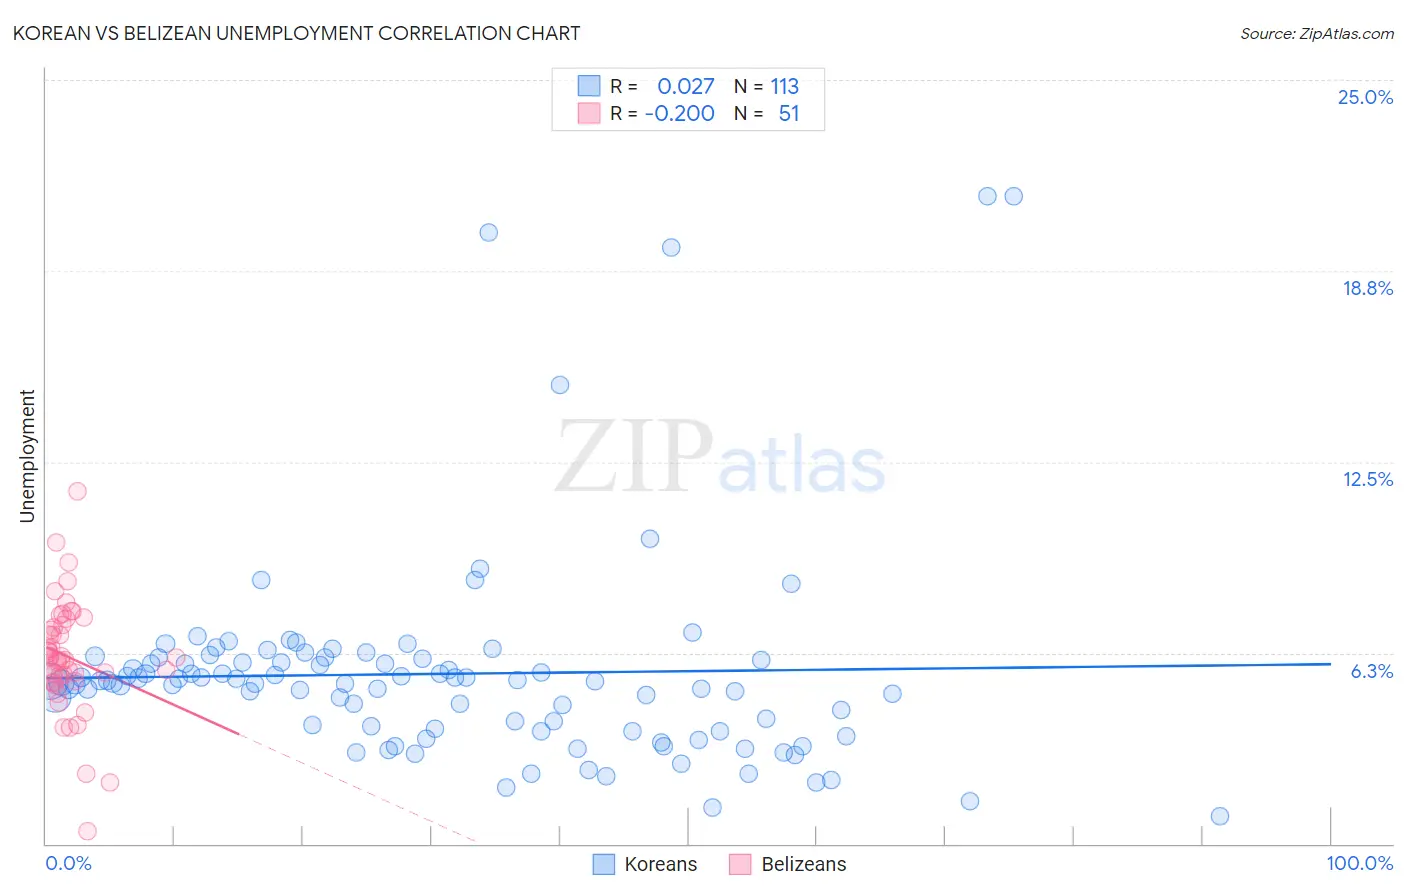
Korean vs Belizean Unemployment Correlation Chart
The statistical analysis conducted on geographies consisting of 509,828,935 people shows no correlation between the proportion of Koreans and unemployment in the United States with a correlation coefficient (R) of 0.027 and weighted average of 5.3%. Similarly, the statistical analysis conducted on geographies consisting of 144,164,887 people shows a poor negative correlation between the proportion of Belizeans and unemployment in the United States with a correlation coefficient (R) of -0.200 and weighted average of 6.4%, a difference of 19.5%.
Unemployment Correlation Summary
| Measurement | Korean | Belizean |
| Minimum | 0.90% | 0.40% |
| Maximum | 21.2% | 11.6% |
| Range | 20.3% | 11.2% |
| Mean | 5.6% | 6.1% |
| Median | 5.3% | 6.1% |
| Interquartile 25% (IQ1) | 3.7% | 5.3% |
| Interquartile 75% (IQ3) | 6.0% | 7.2% |
| Interquartile Range (IQR) | 2.3% | 1.9% |
| Standard Deviation (Sample) | 3.4% | 1.9% |
| Standard Deviation (Population) | 3.4% | 1.9% |
Similar Demographics by Unemployment
Demographics Similar to Koreans by Unemployment
In terms of unemployment, the demographic groups most similar to Koreans are Immigrants from South Eastern Asia (5.3%, a difference of 0.030%), Immigrants from Israel (5.3%, a difference of 0.090%), Immigrants from Afghanistan (5.3%, a difference of 0.090%), Cherokee (5.3%, a difference of 0.14%), and Immigrants from Micronesia (5.3%, a difference of 0.17%).
| Demographics | Rating | Rank | Unemployment |
| Immigrants | Somalia | 33.8 /100 | #193 | Fair 5.3% |
| Immigrants | Laos | 30.9 /100 | #194 | Fair 5.3% |
| Immigrants | Southern Europe | 30.9 /100 | #195 | Fair 5.3% |
| Peruvians | 29.9 /100 | #196 | Fair 5.3% |
| Immigrants | Uruguay | 29.8 /100 | #197 | Fair 5.3% |
| Immigrants | Israel | 28.6 /100 | #198 | Fair 5.3% |
| Immigrants | Afghanistan | 28.6 /100 | #199 | Fair 5.3% |
| Koreans | 27.4 /100 | #200 | Fair 5.3% |
| Immigrants | South Eastern Asia | 27.0 /100 | #201 | Fair 5.3% |
| Cherokee | 25.5 /100 | #202 | Fair 5.3% |
| Immigrants | Micronesia | 25.2 /100 | #203 | Fair 5.3% |
| Immigrants | Ukraine | 24.9 /100 | #204 | Fair 5.3% |
| Native Hawaiians | 24.1 /100 | #205 | Fair 5.3% |
| Immigrants | Peru | 22.7 /100 | #206 | Fair 5.4% |
| Creek | 19.4 /100 | #207 | Poor 5.4% |
Demographics Similar to Belizeans by Unemployment
In terms of unemployment, the demographic groups most similar to Belizeans are West Indian (6.4%, a difference of 0.23%), Trinidadian and Tobagonian (6.3%, a difference of 0.48%), Immigrants from Jamaica (6.4%, a difference of 0.68%), Menominee (6.4%, a difference of 0.93%), and Immigrants from Trinidad and Tobago (6.3%, a difference of 0.97%).
| Demographics | Rating | Rank | Unemployment |
| Ute | 0.0 /100 | #296 | Tragic 6.3% |
| Jamaicans | 0.0 /100 | #297 | Tragic 6.3% |
| Immigrants | Haiti | 0.0 /100 | #298 | Tragic 6.3% |
| Immigrants | West Indies | 0.0 /100 | #299 | Tragic 6.3% |
| Immigrants | Trinidad and Tobago | 0.0 /100 | #300 | Tragic 6.3% |
| Trinidadians and Tobagonians | 0.0 /100 | #301 | Tragic 6.3% |
| West Indians | 0.0 /100 | #302 | Tragic 6.4% |
| Belizeans | 0.0 /100 | #303 | Tragic 6.4% |
| Immigrants | Jamaica | 0.0 /100 | #304 | Tragic 6.4% |
| Menominee | 0.0 /100 | #305 | Tragic 6.4% |
| Lumbee | 0.0 /100 | #306 | Tragic 6.4% |
| Immigrants | Bangladesh | 0.0 /100 | #307 | Tragic 6.5% |
| Barbadians | 0.0 /100 | #308 | Tragic 6.5% |
| Vietnamese | 0.0 /100 | #309 | Tragic 6.5% |
| Immigrants | Belize | 0.0 /100 | #310 | Tragic 6.5% |