Immigrants from Serbia vs Belizean Unemployment
COMPARE
Immigrants from Serbia
Belizean
Unemployment
Unemployment Comparison
Immigrants from Serbia
Belizeans
5.0%
UNEMPLOYMENT
95.6/ 100
METRIC RATING
95th/ 347
METRIC RANK
6.4%
UNEMPLOYMENT
0.0/ 100
METRIC RATING
303rd/ 347
METRIC RANK
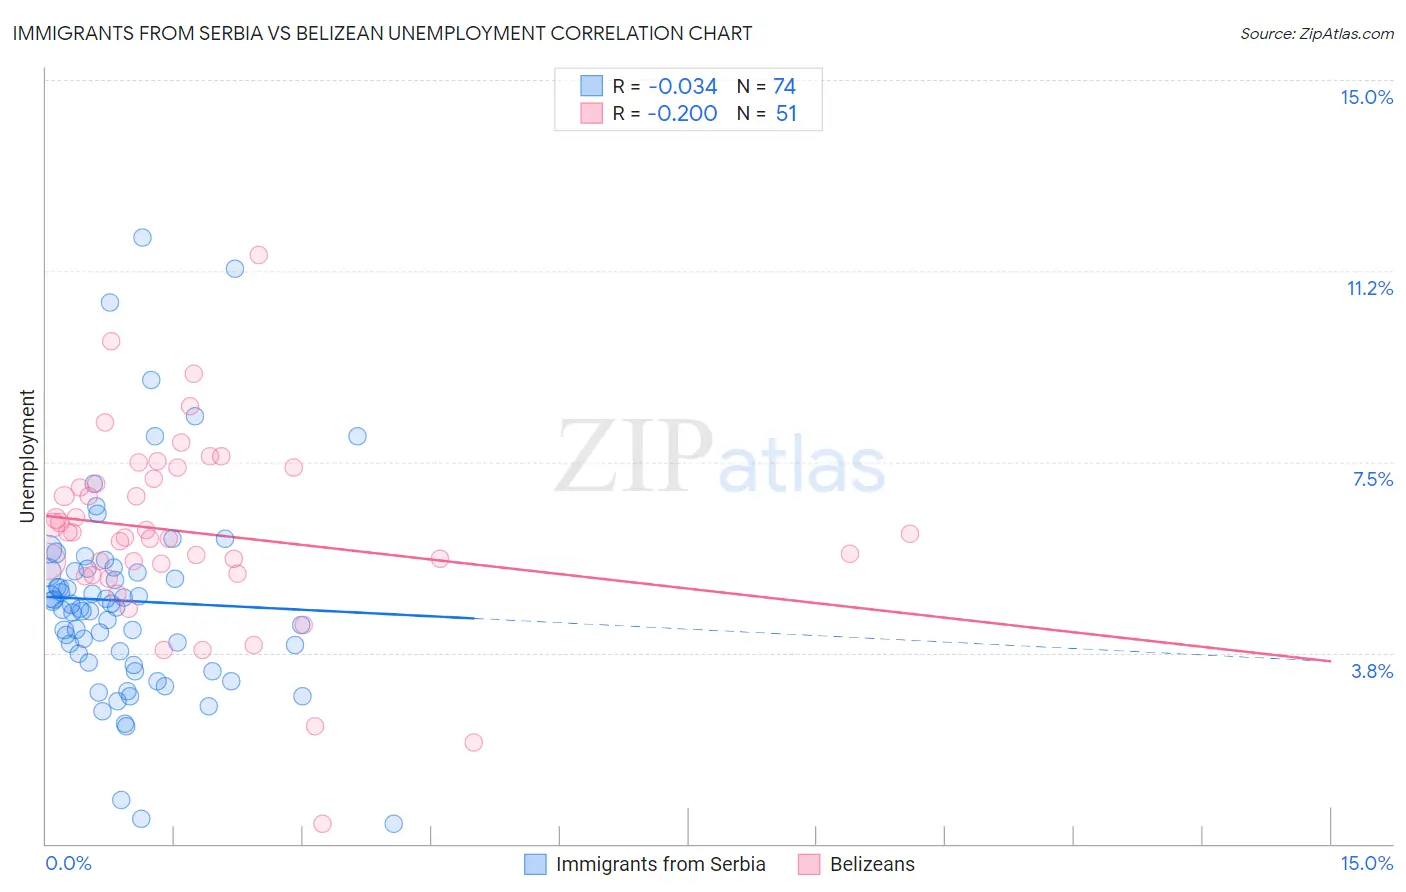
Immigrants from Serbia vs Belizean Unemployment Correlation Chart
The statistical analysis conducted on geographies consisting of 131,730,582 people shows no correlation between the proportion of Immigrants from Serbia and unemployment in the United States with a correlation coefficient (R) of -0.034 and weighted average of 5.0%. Similarly, the statistical analysis conducted on geographies consisting of 144,164,887 people shows a poor negative correlation between the proportion of Belizeans and unemployment in the United States with a correlation coefficient (R) of -0.200 and weighted average of 6.4%, a difference of 27.3%.
Unemployment Correlation Summary
| Measurement | Immigrants from Serbia | Belizean |
| Minimum | 0.40% | 0.40% |
| Maximum | 11.9% | 11.6% |
| Range | 11.5% | 11.2% |
| Mean | 4.8% | 6.1% |
| Median | 4.6% | 6.1% |
| Interquartile 25% (IQ1) | 3.6% | 5.3% |
| Interquartile 75% (IQ3) | 5.4% | 7.2% |
| Interquartile Range (IQR) | 1.8% | 1.9% |
| Standard Deviation (Sample) | 2.1% | 1.9% |
| Standard Deviation (Population) | 2.1% | 1.9% |
Similar Demographics by Unemployment
Demographics Similar to Immigrants from Serbia by Unemployment
In terms of unemployment, the demographic groups most similar to Immigrants from Serbia are Immigrants from Austria (5.0%, a difference of 0.13%), Immigrants from England (5.0%, a difference of 0.16%), Ukrainian (5.0%, a difference of 0.17%), Immigrants from Czechoslovakia (5.0%, a difference of 0.19%), and Romanian (5.0%, a difference of 0.22%).
| Demographics | Rating | Rank | Unemployment |
| Immigrants | Korea | 96.6 /100 | #88 | Exceptional 5.0% |
| Jordanians | 96.4 /100 | #89 | Exceptional 5.0% |
| Immigrants | North Macedonia | 96.3 /100 | #90 | Exceptional 5.0% |
| Immigrants | Sudan | 96.3 /100 | #91 | Exceptional 5.0% |
| Immigrants | South Africa | 96.2 /100 | #92 | Exceptional 5.0% |
| Ukrainians | 96.0 /100 | #93 | Exceptional 5.0% |
| Immigrants | Austria | 95.9 /100 | #94 | Exceptional 5.0% |
| Immigrants | Serbia | 95.6 /100 | #95 | Exceptional 5.0% |
| Immigrants | England | 95.2 /100 | #96 | Exceptional 5.0% |
| Immigrants | Czechoslovakia | 95.1 /100 | #97 | Exceptional 5.0% |
| Romanians | 95.0 /100 | #98 | Exceptional 5.0% |
| Mongolians | 94.8 /100 | #99 | Exceptional 5.0% |
| Estonians | 94.6 /100 | #100 | Exceptional 5.0% |
| Americans | 94.3 /100 | #101 | Exceptional 5.0% |
| Immigrants | Argentina | 94.1 /100 | #102 | Exceptional 5.0% |
Demographics Similar to Belizeans by Unemployment
In terms of unemployment, the demographic groups most similar to Belizeans are West Indian (6.4%, a difference of 0.23%), Trinidadian and Tobagonian (6.3%, a difference of 0.48%), Immigrants from Jamaica (6.4%, a difference of 0.68%), Menominee (6.4%, a difference of 0.93%), and Immigrants from Trinidad and Tobago (6.3%, a difference of 0.97%).
| Demographics | Rating | Rank | Unemployment |
| Ute | 0.0 /100 | #296 | Tragic 6.3% |
| Jamaicans | 0.0 /100 | #297 | Tragic 6.3% |
| Immigrants | Haiti | 0.0 /100 | #298 | Tragic 6.3% |
| Immigrants | West Indies | 0.0 /100 | #299 | Tragic 6.3% |
| Immigrants | Trinidad and Tobago | 0.0 /100 | #300 | Tragic 6.3% |
| Trinidadians and Tobagonians | 0.0 /100 | #301 | Tragic 6.3% |
| West Indians | 0.0 /100 | #302 | Tragic 6.4% |
| Belizeans | 0.0 /100 | #303 | Tragic 6.4% |
| Immigrants | Jamaica | 0.0 /100 | #304 | Tragic 6.4% |
| Menominee | 0.0 /100 | #305 | Tragic 6.4% |
| Lumbee | 0.0 /100 | #306 | Tragic 6.4% |
| Immigrants | Bangladesh | 0.0 /100 | #307 | Tragic 6.5% |
| Barbadians | 0.0 /100 | #308 | Tragic 6.5% |
| Vietnamese | 0.0 /100 | #309 | Tragic 6.5% |
| Immigrants | Belize | 0.0 /100 | #310 | Tragic 6.5% |