Chippewa vs Immigrants from West Indies Female Unemployment
COMPARE
Chippewa
Immigrants from West Indies
Female Unemployment
Female Unemployment Comparison
Chippewa
Immigrants from West Indies
6.1%
FEMALE UNEMPLOYMENT
0.0/ 100
METRIC RATING
286th/ 347
METRIC RANK
6.1%
FEMALE UNEMPLOYMENT
0.0/ 100
METRIC RATING
291st/ 347
METRIC RANK
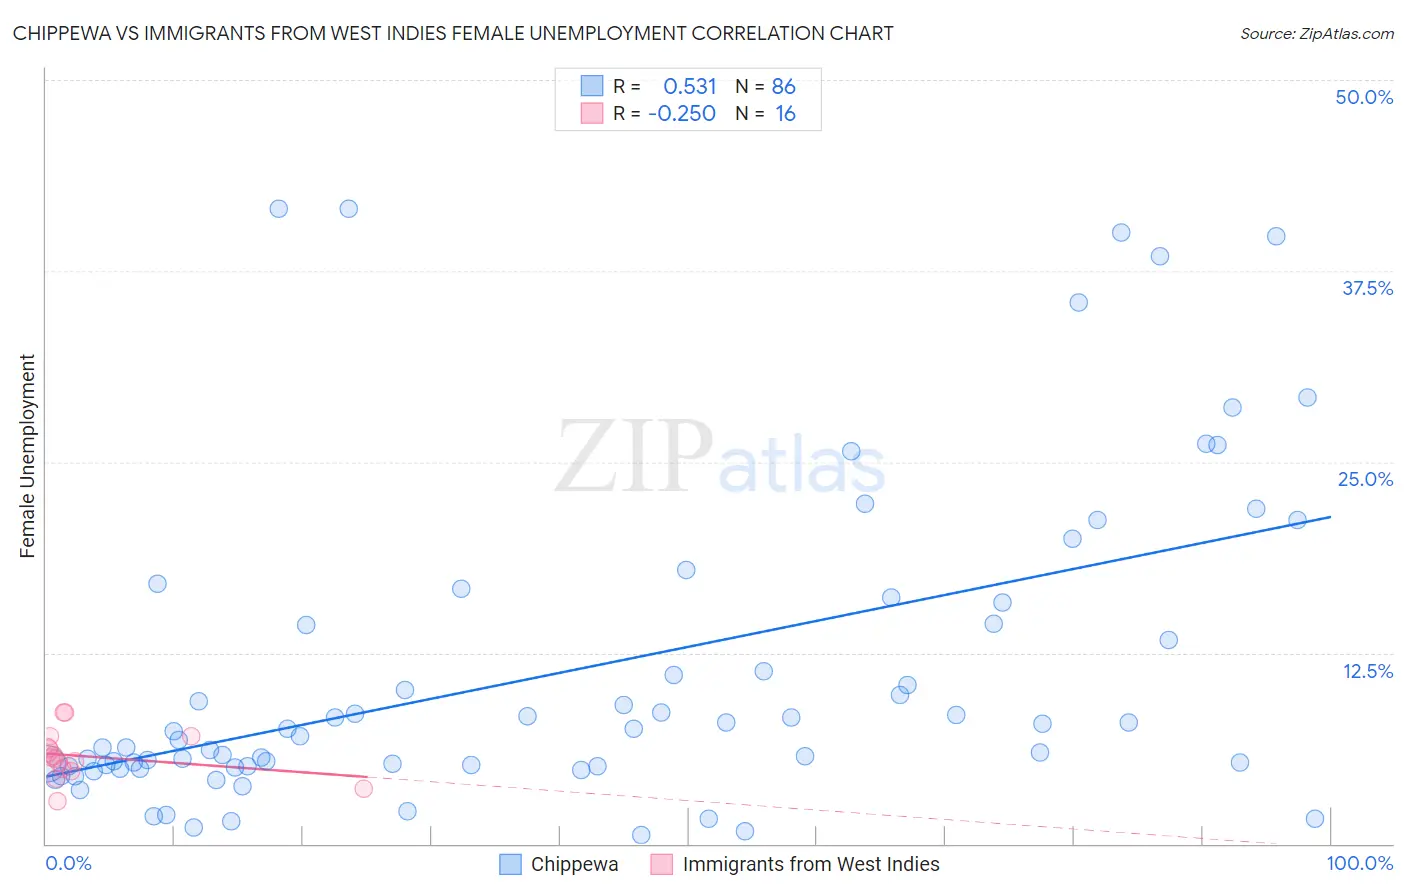
Chippewa vs Immigrants from West Indies Female Unemployment Correlation Chart
The statistical analysis conducted on geographies consisting of 213,753,903 people shows a substantial positive correlation between the proportion of Chippewa and unemploymnet rate among females in the United States with a correlation coefficient (R) of 0.531 and weighted average of 6.1%. Similarly, the statistical analysis conducted on geographies consisting of 72,427,416 people shows a weak negative correlation between the proportion of Immigrants from West Indies and unemploymnet rate among females in the United States with a correlation coefficient (R) of -0.250 and weighted average of 6.1%, a difference of 0.25%.
Female Unemployment Correlation Summary
| Measurement | Chippewa | Immigrants from West Indies |
| Minimum | 0.60% | 2.8% |
| Maximum | 41.6% | 8.6% |
| Range | 41.0% | 5.8% |
| Mean | 11.2% | 5.7% |
| Median | 7.2% | 5.6% |
| Interquartile 25% (IQ1) | 5.1% | 4.9% |
| Interquartile 75% (IQ3) | 14.4% | 6.6% |
| Interquartile Range (IQR) | 9.3% | 1.8% |
| Standard Deviation (Sample) | 10.3% | 1.6% |
| Standard Deviation (Population) | 10.2% | 1.5% |
Demographics Similar to Chippewa and Immigrants from West Indies by Female Unemployment
In terms of female unemployment, the demographic groups most similar to Chippewa are Immigrants from Cabo Verde (6.1%, a difference of 0.030%), Immigrants from Guatemala (6.1%, a difference of 0.030%), Haitian (6.1%, a difference of 0.070%), Trinidadian and Tobagonian (6.1%, a difference of 0.080%), and Immigrants from Caribbean (6.1%, a difference of 0.14%). Similarly, the demographic groups most similar to Immigrants from West Indies are Immigrants from Trinidad and Tobago (6.1%, a difference of 0.060%), Immigrants from Caribbean (6.1%, a difference of 0.11%), Mexican (6.1%, a difference of 0.15%), Trinidadian and Tobagonian (6.1%, a difference of 0.17%), and Haitian (6.1%, a difference of 0.18%).
| Demographics | Rating | Rank | Female Unemployment |
| Yaqui | 0.0 /100 | #278 | Tragic 6.0% |
| Armenians | 0.0 /100 | #279 | Tragic 6.0% |
| Mexican American Indians | 0.0 /100 | #280 | Tragic 6.0% |
| Guatemalans | 0.0 /100 | #281 | Tragic 6.0% |
| Colville | 0.0 /100 | #282 | Tragic 6.0% |
| Salvadorans | 0.0 /100 | #283 | Tragic 6.0% |
| Immigrants | Senegal | 0.0 /100 | #284 | Tragic 6.1% |
| Immigrants | Cabo Verde | 0.0 /100 | #285 | Tragic 6.1% |
| Chippewa | 0.0 /100 | #286 | Tragic 6.1% |
| Immigrants | Guatemala | 0.0 /100 | #287 | Tragic 6.1% |
| Haitians | 0.0 /100 | #288 | Tragic 6.1% |
| Trinidadians and Tobagonians | 0.0 /100 | #289 | Tragic 6.1% |
| Immigrants | Caribbean | 0.0 /100 | #290 | Tragic 6.1% |
| Immigrants | West Indies | 0.0 /100 | #291 | Tragic 6.1% |
| Immigrants | Trinidad and Tobago | 0.0 /100 | #292 | Tragic 6.1% |
| Mexicans | 0.0 /100 | #293 | Tragic 6.1% |
| Immigrants | El Salvador | 0.0 /100 | #294 | Tragic 6.1% |
| Immigrants | Latin America | 0.0 /100 | #295 | Tragic 6.1% |
| Alaskan Athabascans | 0.0 /100 | #296 | Tragic 6.1% |
| West Indians | 0.0 /100 | #297 | Tragic 6.1% |
| Jamaicans | 0.0 /100 | #298 | Tragic 6.1% |