Chippewa vs Immigrants from Italy Female Unemployment
COMPARE
Chippewa
Immigrants from Italy
Female Unemployment
Female Unemployment Comparison
Chippewa
Immigrants from Italy
6.1%
FEMALE UNEMPLOYMENT
0.0/ 100
METRIC RATING
286th/ 347
METRIC RANK
5.2%
FEMALE UNEMPLOYMENT
75.0/ 100
METRIC RATING
152nd/ 347
METRIC RANK
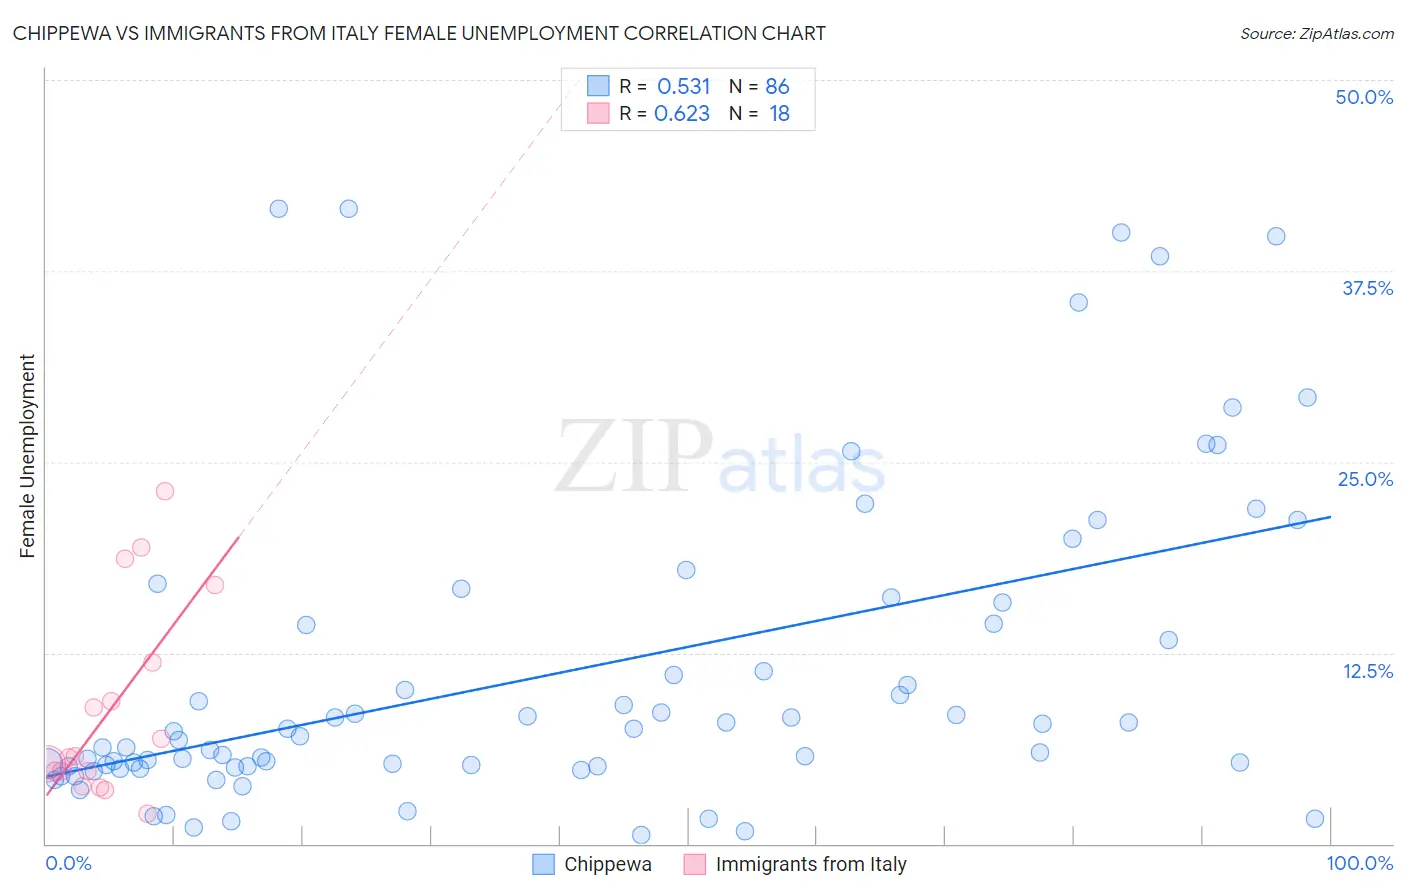
Chippewa vs Immigrants from Italy Female Unemployment Correlation Chart
The statistical analysis conducted on geographies consisting of 213,753,903 people shows a substantial positive correlation between the proportion of Chippewa and unemploymnet rate among females in the United States with a correlation coefficient (R) of 0.531 and weighted average of 6.1%. Similarly, the statistical analysis conducted on geographies consisting of 323,110,337 people shows a significant positive correlation between the proportion of Immigrants from Italy and unemploymnet rate among females in the United States with a correlation coefficient (R) of 0.623 and weighted average of 5.2%, a difference of 17.7%.
Female Unemployment Correlation Summary
| Measurement | Chippewa | Immigrants from Italy |
| Minimum | 0.60% | 2.0% |
| Maximum | 41.6% | 23.1% |
| Range | 41.0% | 21.1% |
| Mean | 11.2% | 8.8% |
| Median | 7.2% | 5.7% |
| Interquartile 25% (IQ1) | 5.1% | 4.7% |
| Interquartile 75% (IQ3) | 14.4% | 11.9% |
| Interquartile Range (IQR) | 9.3% | 7.2% |
| Standard Deviation (Sample) | 10.3% | 6.4% |
| Standard Deviation (Population) | 10.2% | 6.2% |
Similar Demographics by Female Unemployment
Demographics Similar to Chippewa by Female Unemployment
In terms of female unemployment, the demographic groups most similar to Chippewa are Immigrants from Cabo Verde (6.1%, a difference of 0.030%), Immigrants from Guatemala (6.1%, a difference of 0.030%), Haitian (6.1%, a difference of 0.070%), Trinidadian and Tobagonian (6.1%, a difference of 0.080%), and Immigrants from Caribbean (6.1%, a difference of 0.14%).
| Demographics | Rating | Rank | Female Unemployment |
| Armenians | 0.0 /100 | #279 | Tragic 6.0% |
| Mexican American Indians | 0.0 /100 | #280 | Tragic 6.0% |
| Guatemalans | 0.0 /100 | #281 | Tragic 6.0% |
| Colville | 0.0 /100 | #282 | Tragic 6.0% |
| Salvadorans | 0.0 /100 | #283 | Tragic 6.0% |
| Immigrants | Senegal | 0.0 /100 | #284 | Tragic 6.1% |
| Immigrants | Cabo Verde | 0.0 /100 | #285 | Tragic 6.1% |
| Chippewa | 0.0 /100 | #286 | Tragic 6.1% |
| Immigrants | Guatemala | 0.0 /100 | #287 | Tragic 6.1% |
| Haitians | 0.0 /100 | #288 | Tragic 6.1% |
| Trinidadians and Tobagonians | 0.0 /100 | #289 | Tragic 6.1% |
| Immigrants | Caribbean | 0.0 /100 | #290 | Tragic 6.1% |
| Immigrants | West Indies | 0.0 /100 | #291 | Tragic 6.1% |
| Immigrants | Trinidad and Tobago | 0.0 /100 | #292 | Tragic 6.1% |
| Mexicans | 0.0 /100 | #293 | Tragic 6.1% |
Demographics Similar to Immigrants from Italy by Female Unemployment
In terms of female unemployment, the demographic groups most similar to Immigrants from Italy are Immigrants from Greece (5.2%, a difference of 0.010%), Immigrants from China (5.2%, a difference of 0.080%), Egyptian (5.2%, a difference of 0.28%), Asian (5.2%, a difference of 0.29%), and Immigrants from Argentina (5.2%, a difference of 0.32%).
| Demographics | Rating | Rank | Female Unemployment |
| Immigrants | Oceania | 79.5 /100 | #145 | Good 5.2% |
| Immigrants | Norway | 79.4 /100 | #146 | Good 5.2% |
| Argentineans | 79.2 /100 | #147 | Good 5.2% |
| Immigrants | Argentina | 78.7 /100 | #148 | Good 5.2% |
| Asians | 78.3 /100 | #149 | Good 5.2% |
| Egyptians | 78.3 /100 | #150 | Good 5.2% |
| Immigrants | China | 75.9 /100 | #151 | Good 5.2% |
| Immigrants | Italy | 75.0 /100 | #152 | Good 5.2% |
| Immigrants | Greece | 74.9 /100 | #153 | Good 5.2% |
| South Africans | 70.8 /100 | #154 | Good 5.2% |
| Immigrants | Egypt | 70.0 /100 | #155 | Good 5.2% |
| Immigrants | Northern Africa | 69.6 /100 | #156 | Good 5.2% |
| Immigrants | Russia | 69.3 /100 | #157 | Good 5.2% |
| Albanians | 68.3 /100 | #158 | Good 5.2% |
| Immigrants | Micronesia | 66.9 /100 | #159 | Good 5.2% |