Chippewa vs Immigrants from West Indies In Labor Force | Age 20-64
COMPARE
Chippewa
Immigrants from West Indies
In Labor Force | Age 20-64
In Labor Force | Age 20-64 Comparison
Chippewa
Immigrants from West Indies
77.3%
IN LABOR FORCE | AGE 20-64
0.0/ 100
METRIC RATING
303rd/ 347
METRIC RANK
78.9%
IN LABOR FORCE | AGE 20-64
1.7/ 100
METRIC RATING
243rd/ 347
METRIC RANK
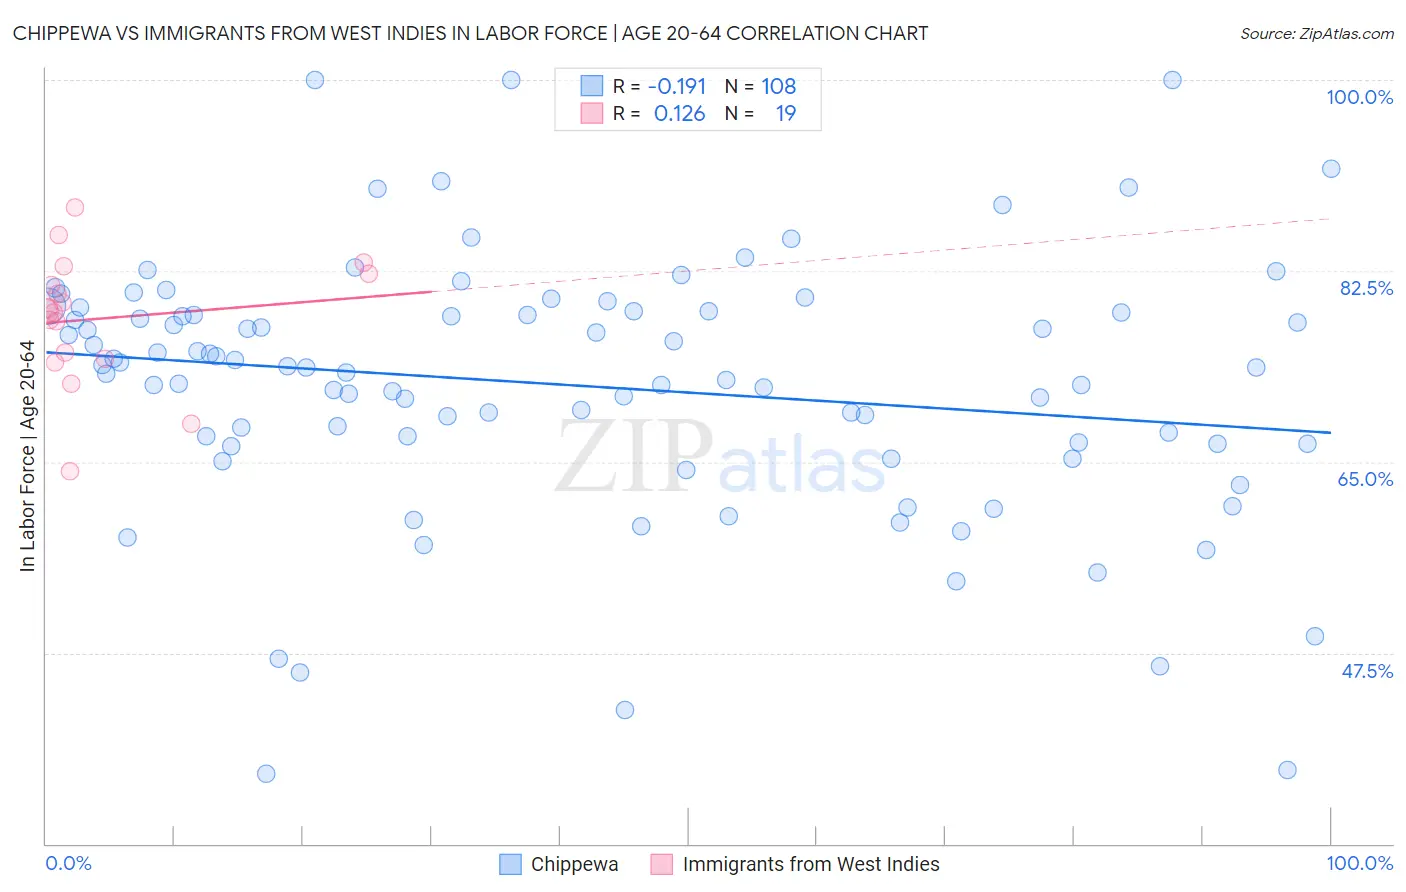
Chippewa vs Immigrants from West Indies In Labor Force | Age 20-64 Correlation Chart
The statistical analysis conducted on geographies consisting of 215,053,838 people shows a poor negative correlation between the proportion of Chippewa and labor force participation rate among population between the ages 20 and 64 in the United States with a correlation coefficient (R) of -0.191 and weighted average of 77.3%. Similarly, the statistical analysis conducted on geographies consisting of 72,456,461 people shows a poor positive correlation between the proportion of Immigrants from West Indies and labor force participation rate among population between the ages 20 and 64 in the United States with a correlation coefficient (R) of 0.126 and weighted average of 78.9%, a difference of 2.1%.
In Labor Force | Age 20-64 Correlation Summary
| Measurement | Chippewa | Immigrants from West Indies |
| Minimum | 36.4% | 64.1% |
| Maximum | 100.0% | 88.3% |
| Range | 63.6% | 24.2% |
| Mean | 72.0% | 78.1% |
| Median | 73.6% | 78.8% |
| Interquartile 25% (IQ1) | 66.7% | 74.5% |
| Interquartile 75% (IQ3) | 78.7% | 82.2% |
| Interquartile Range (IQR) | 12.0% | 7.7% |
| Standard Deviation (Sample) | 11.9% | 5.8% |
| Standard Deviation (Population) | 11.9% | 5.7% |
Similar Demographics by In Labor Force | Age 20-64
Demographics Similar to Chippewa by In Labor Force | Age 20-64
In terms of in labor force | age 20-64, the demographic groups most similar to Chippewa are Immigrants from Mexico (77.3%, a difference of 0.070%), Mexican (77.2%, a difference of 0.11%), Potawatomi (77.2%, a difference of 0.12%), Iroquois (77.5%, a difference of 0.22%), and Nepalese (77.5%, a difference of 0.27%).
| Demographics | Rating | Rank | In Labor Force | Age 20-64 |
| Immigrants | Dominican Republic | 0.0 /100 | #296 | Tragic 77.7% |
| Dominicans | 0.0 /100 | #297 | Tragic 77.7% |
| Cree | 0.0 /100 | #298 | Tragic 77.7% |
| Hispanics or Latinos | 0.0 /100 | #299 | Tragic 77.6% |
| Spanish American Indians | 0.0 /100 | #300 | Tragic 77.6% |
| Nepalese | 0.0 /100 | #301 | Tragic 77.5% |
| Iroquois | 0.0 /100 | #302 | Tragic 77.5% |
| Chippewa | 0.0 /100 | #303 | Tragic 77.3% |
| Immigrants | Mexico | 0.0 /100 | #304 | Tragic 77.3% |
| Mexicans | 0.0 /100 | #305 | Tragic 77.2% |
| Potawatomi | 0.0 /100 | #306 | Tragic 77.2% |
| Central American Indians | 0.0 /100 | #307 | Tragic 77.1% |
| Alaska Natives | 0.0 /100 | #308 | Tragic 77.0% |
| Americans | 0.0 /100 | #309 | Tragic 77.0% |
| Comanche | 0.0 /100 | #310 | Tragic 77.0% |
Demographics Similar to Immigrants from West Indies by In Labor Force | Age 20-64
In terms of in labor force | age 20-64, the demographic groups most similar to Immigrants from West Indies are Immigrants from Micronesia (78.9%, a difference of 0.020%), Jamaican (78.9%, a difference of 0.030%), French (78.9%, a difference of 0.030%), Trinidadian and Tobagonian (79.0%, a difference of 0.060%), and Welsh (79.0%, a difference of 0.070%).
| Demographics | Rating | Rank | In Labor Force | Age 20-64 |
| Samoans | 2.9 /100 | #236 | Tragic 79.0% |
| Immigrants | North America | 2.9 /100 | #237 | Tragic 79.0% |
| Immigrants | Jamaica | 2.6 /100 | #238 | Tragic 79.0% |
| Welsh | 2.4 /100 | #239 | Tragic 79.0% |
| Trinidadians and Tobagonians | 2.3 /100 | #240 | Tragic 79.0% |
| Jamaicans | 2.0 /100 | #241 | Tragic 78.9% |
| Immigrants | Micronesia | 1.9 /100 | #242 | Tragic 78.9% |
| Immigrants | West Indies | 1.7 /100 | #243 | Tragic 78.9% |
| French | 1.5 /100 | #244 | Tragic 78.9% |
| Scottish | 1.3 /100 | #245 | Tragic 78.9% |
| Immigrants | Trinidad and Tobago | 1.1 /100 | #246 | Tragic 78.8% |
| Immigrants | Germany | 1.0 /100 | #247 | Tragic 78.8% |
| Immigrants | Caribbean | 1.0 /100 | #248 | Tragic 78.8% |
| English | 0.9 /100 | #249 | Tragic 78.8% |
| Hondurans | 0.8 /100 | #250 | Tragic 78.8% |