Chippewa vs Immigrants from Grenada Female Unemployment
COMPARE
Chippewa
Immigrants from Grenada
Female Unemployment
Female Unemployment Comparison
Chippewa
Immigrants from Grenada
6.1%
FEMALE UNEMPLOYMENT
0.0/ 100
METRIC RATING
286th/ 347
METRIC RANK
6.3%
FEMALE UNEMPLOYMENT
0.0/ 100
METRIC RATING
312th/ 347
METRIC RANK
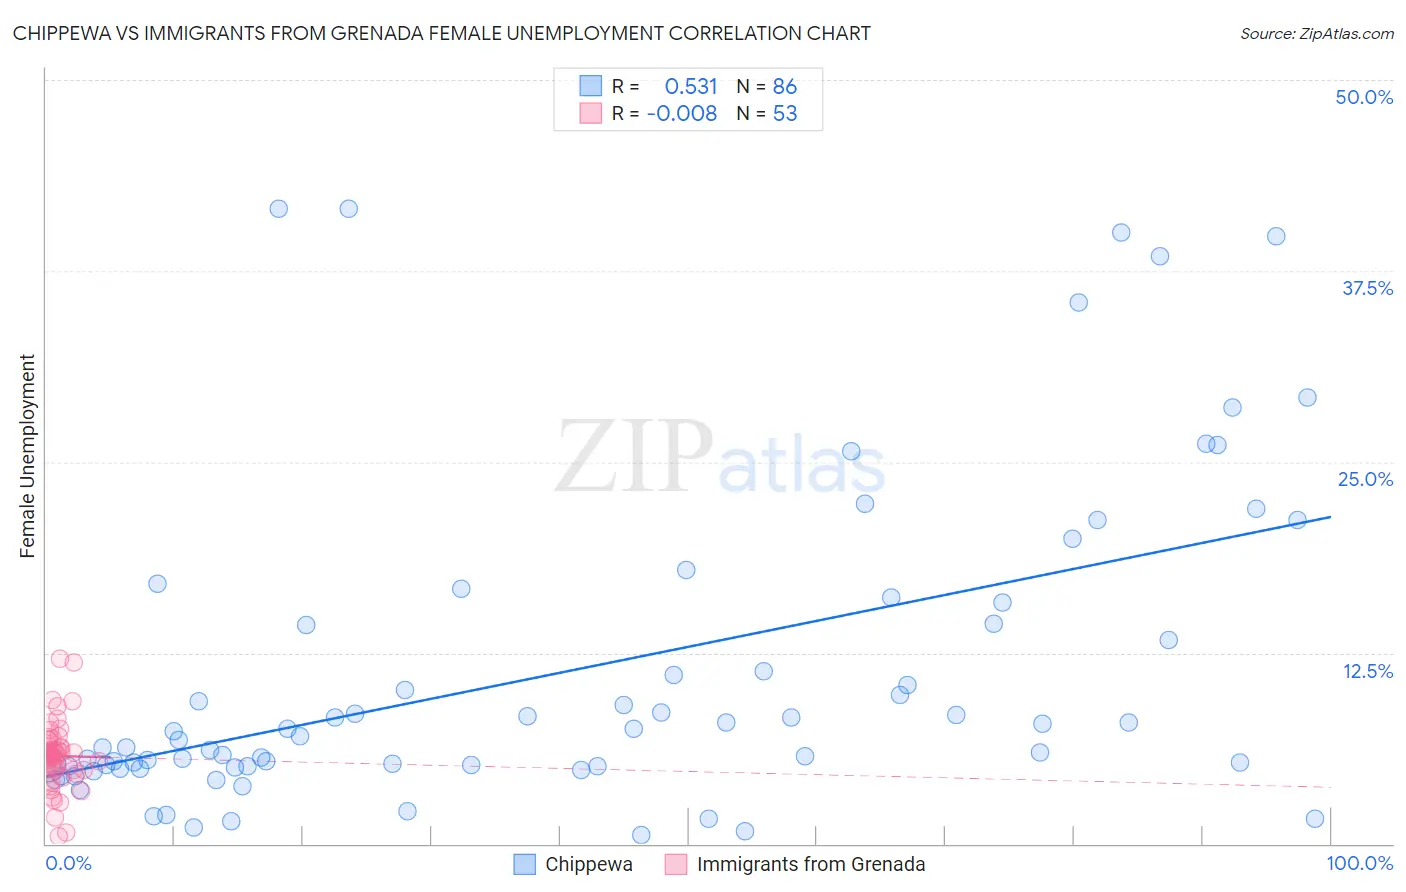
Chippewa vs Immigrants from Grenada Female Unemployment Correlation Chart
The statistical analysis conducted on geographies consisting of 213,753,903 people shows a substantial positive correlation between the proportion of Chippewa and unemploymnet rate among females in the United States with a correlation coefficient (R) of 0.531 and weighted average of 6.1%. Similarly, the statistical analysis conducted on geographies consisting of 67,141,696 people shows no correlation between the proportion of Immigrants from Grenada and unemploymnet rate among females in the United States with a correlation coefficient (R) of -0.008 and weighted average of 6.3%, a difference of 4.3%.
Female Unemployment Correlation Summary
| Measurement | Chippewa | Immigrants from Grenada |
| Minimum | 0.60% | 0.50% |
| Maximum | 41.6% | 12.1% |
| Range | 41.0% | 11.6% |
| Mean | 11.2% | 5.7% |
| Median | 7.2% | 5.9% |
| Interquartile 25% (IQ1) | 5.1% | 4.8% |
| Interquartile 75% (IQ3) | 14.4% | 6.7% |
| Interquartile Range (IQR) | 9.3% | 1.9% |
| Standard Deviation (Sample) | 10.3% | 2.2% |
| Standard Deviation (Population) | 10.2% | 2.2% |
Similar Demographics by Female Unemployment
Demographics Similar to Chippewa by Female Unemployment
In terms of female unemployment, the demographic groups most similar to Chippewa are Immigrants from Cabo Verde (6.1%, a difference of 0.030%), Immigrants from Guatemala (6.1%, a difference of 0.030%), Haitian (6.1%, a difference of 0.070%), Trinidadian and Tobagonian (6.1%, a difference of 0.080%), and Immigrants from Caribbean (6.1%, a difference of 0.14%).
| Demographics | Rating | Rank | Female Unemployment |
| Armenians | 0.0 /100 | #279 | Tragic 6.0% |
| Mexican American Indians | 0.0 /100 | #280 | Tragic 6.0% |
| Guatemalans | 0.0 /100 | #281 | Tragic 6.0% |
| Colville | 0.0 /100 | #282 | Tragic 6.0% |
| Salvadorans | 0.0 /100 | #283 | Tragic 6.0% |
| Immigrants | Senegal | 0.0 /100 | #284 | Tragic 6.1% |
| Immigrants | Cabo Verde | 0.0 /100 | #285 | Tragic 6.1% |
| Chippewa | 0.0 /100 | #286 | Tragic 6.1% |
| Immigrants | Guatemala | 0.0 /100 | #287 | Tragic 6.1% |
| Haitians | 0.0 /100 | #288 | Tragic 6.1% |
| Trinidadians and Tobagonians | 0.0 /100 | #289 | Tragic 6.1% |
| Immigrants | Caribbean | 0.0 /100 | #290 | Tragic 6.1% |
| Immigrants | West Indies | 0.0 /100 | #291 | Tragic 6.1% |
| Immigrants | Trinidad and Tobago | 0.0 /100 | #292 | Tragic 6.1% |
| Mexicans | 0.0 /100 | #293 | Tragic 6.1% |
Demographics Similar to Immigrants from Grenada by Female Unemployment
In terms of female unemployment, the demographic groups most similar to Immigrants from Grenada are Belizean (6.3%, a difference of 0.010%), Immigrants from Ecuador (6.4%, a difference of 0.24%), Pueblo (6.4%, a difference of 0.55%), Immigrants from Mexico (6.3%, a difference of 0.66%), and Central American Indian (6.3%, a difference of 0.79%).
| Demographics | Rating | Rank | Female Unemployment |
| Spanish American Indians | 0.0 /100 | #305 | Tragic 6.2% |
| Immigrants | Central America | 0.0 /100 | #306 | Tragic 6.2% |
| Shoshone | 0.0 /100 | #307 | Tragic 6.2% |
| Hispanics or Latinos | 0.0 /100 | #308 | Tragic 6.2% |
| Ecuadorians | 0.0 /100 | #309 | Tragic 6.3% |
| Central American Indians | 0.0 /100 | #310 | Tragic 6.3% |
| Immigrants | Mexico | 0.0 /100 | #311 | Tragic 6.3% |
| Immigrants | Grenada | 0.0 /100 | #312 | Tragic 6.3% |
| Belizeans | 0.0 /100 | #313 | Tragic 6.3% |
| Immigrants | Ecuador | 0.0 /100 | #314 | Tragic 6.4% |
| Pueblo | 0.0 /100 | #315 | Tragic 6.4% |
| Houma | 0.0 /100 | #316 | Tragic 6.4% |
| Immigrants | St. Vincent and the Grenadines | 0.0 /100 | #317 | Tragic 6.4% |
| British West Indians | 0.0 /100 | #318 | Tragic 6.4% |
| Immigrants | Bangladesh | 0.0 /100 | #319 | Tragic 6.5% |