Spanish vs Immigrants from West Indies Female Unemployment
COMPARE
Spanish
Immigrants from West Indies
Female Unemployment
Female Unemployment Comparison
Spanish
Immigrants from West Indies
5.2%
FEMALE UNEMPLOYMENT
55.9/ 100
METRIC RATING
170th/ 347
METRIC RANK
6.1%
FEMALE UNEMPLOYMENT
0.0/ 100
METRIC RATING
291st/ 347
METRIC RANK
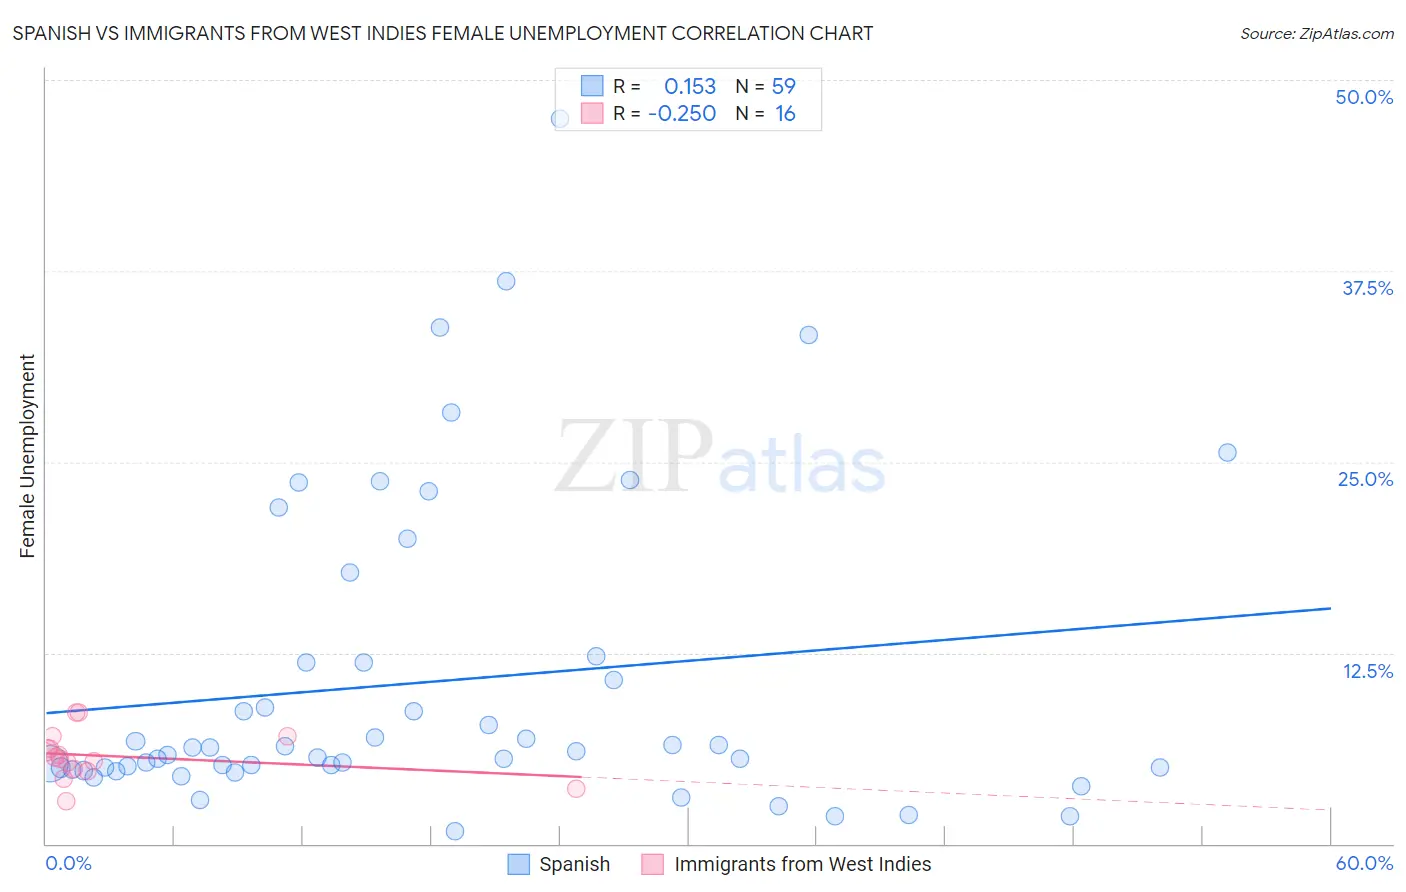
Spanish vs Immigrants from West Indies Female Unemployment Correlation Chart
The statistical analysis conducted on geographies consisting of 419,412,543 people shows a poor positive correlation between the proportion of Spanish and unemploymnet rate among females in the United States with a correlation coefficient (R) of 0.153 and weighted average of 5.2%. Similarly, the statistical analysis conducted on geographies consisting of 72,427,416 people shows a weak negative correlation between the proportion of Immigrants from West Indies and unemploymnet rate among females in the United States with a correlation coefficient (R) of -0.250 and weighted average of 6.1%, a difference of 16.4%.
Female Unemployment Correlation Summary
| Measurement | Spanish | Immigrants from West Indies |
| Minimum | 0.80% | 2.8% |
| Maximum | 47.5% | 8.6% |
| Range | 46.7% | 5.8% |
| Mean | 10.6% | 5.7% |
| Median | 6.1% | 5.6% |
| Interquartile 25% (IQ1) | 5.0% | 4.9% |
| Interquartile 75% (IQ3) | 11.9% | 6.6% |
| Interquartile Range (IQR) | 6.9% | 1.8% |
| Standard Deviation (Sample) | 10.1% | 1.6% |
| Standard Deviation (Population) | 10.0% | 1.5% |
Similar Demographics by Female Unemployment
Demographics Similar to Spanish by Female Unemployment
In terms of female unemployment, the demographic groups most similar to Spanish are Immigrants from Denmark (5.2%, a difference of 0.050%), Immigrants from Chile (5.2%, a difference of 0.19%), Sri Lankan (5.2%, a difference of 0.22%), Immigrants from Uganda (5.3%, a difference of 0.31%), and Iranian (5.3%, a difference of 0.33%).
| Demographics | Rating | Rank | Female Unemployment |
| Immigrants | Asia | 64.3 /100 | #163 | Good 5.2% |
| Bangladeshis | 64.3 /100 | #164 | Good 5.2% |
| Syrians | 62.8 /100 | #165 | Good 5.2% |
| Native Hawaiians | 62.7 /100 | #166 | Good 5.2% |
| Immigrants | Thailand | 62.1 /100 | #167 | Good 5.2% |
| Sri Lankans | 59.4 /100 | #168 | Average 5.2% |
| Immigrants | Chile | 59.0 /100 | #169 | Average 5.2% |
| Spanish | 55.9 /100 | #170 | Average 5.2% |
| Immigrants | Denmark | 55.0 /100 | #171 | Average 5.2% |
| Immigrants | Uganda | 50.7 /100 | #172 | Average 5.3% |
| Iranians | 50.4 /100 | #173 | Average 5.3% |
| Immigrants | Poland | 50.0 /100 | #174 | Average 5.3% |
| Immigrants | Laos | 47.5 /100 | #175 | Average 5.3% |
| Immigrants | Vietnam | 47.5 /100 | #176 | Average 5.3% |
| Immigrants | Morocco | 47.4 /100 | #177 | Average 5.3% |
Demographics Similar to Immigrants from West Indies by Female Unemployment
In terms of female unemployment, the demographic groups most similar to Immigrants from West Indies are Immigrants from Trinidad and Tobago (6.1%, a difference of 0.060%), Immigrants from Caribbean (6.1%, a difference of 0.11%), Mexican (6.1%, a difference of 0.15%), Trinidadian and Tobagonian (6.1%, a difference of 0.17%), and Haitian (6.1%, a difference of 0.18%).
| Demographics | Rating | Rank | Female Unemployment |
| Immigrants | Senegal | 0.0 /100 | #284 | Tragic 6.1% |
| Immigrants | Cabo Verde | 0.0 /100 | #285 | Tragic 6.1% |
| Chippewa | 0.0 /100 | #286 | Tragic 6.1% |
| Immigrants | Guatemala | 0.0 /100 | #287 | Tragic 6.1% |
| Haitians | 0.0 /100 | #288 | Tragic 6.1% |
| Trinidadians and Tobagonians | 0.0 /100 | #289 | Tragic 6.1% |
| Immigrants | Caribbean | 0.0 /100 | #290 | Tragic 6.1% |
| Immigrants | West Indies | 0.0 /100 | #291 | Tragic 6.1% |
| Immigrants | Trinidad and Tobago | 0.0 /100 | #292 | Tragic 6.1% |
| Mexicans | 0.0 /100 | #293 | Tragic 6.1% |
| Immigrants | El Salvador | 0.0 /100 | #294 | Tragic 6.1% |
| Immigrants | Latin America | 0.0 /100 | #295 | Tragic 6.1% |
| Alaskan Athabascans | 0.0 /100 | #296 | Tragic 6.1% |
| West Indians | 0.0 /100 | #297 | Tragic 6.1% |
| Jamaicans | 0.0 /100 | #298 | Tragic 6.1% |