Chippewa vs Immigrants from Costa Rica Female Unemployment
COMPARE
Chippewa
Immigrants from Costa Rica
Female Unemployment
Female Unemployment Comparison
Chippewa
Immigrants from Costa Rica
6.1%
FEMALE UNEMPLOYMENT
0.0/ 100
METRIC RATING
286th/ 347
METRIC RANK
5.4%
FEMALE UNEMPLOYMENT
13.7/ 100
METRIC RATING
208th/ 347
METRIC RANK
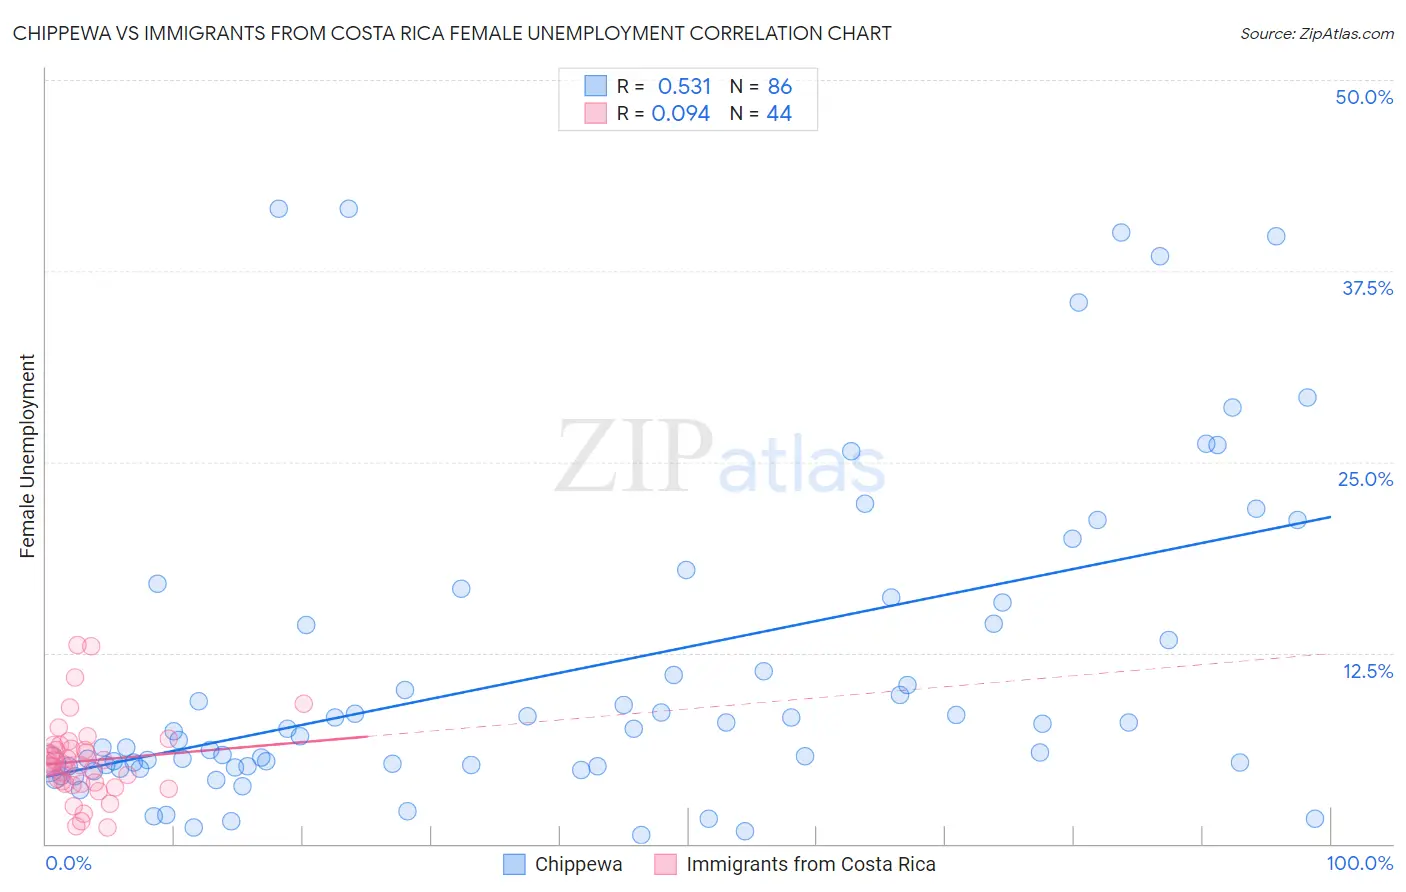
Chippewa vs Immigrants from Costa Rica Female Unemployment Correlation Chart
The statistical analysis conducted on geographies consisting of 213,753,903 people shows a substantial positive correlation between the proportion of Chippewa and unemploymnet rate among females in the United States with a correlation coefficient (R) of 0.531 and weighted average of 6.1%. Similarly, the statistical analysis conducted on geographies consisting of 203,916,192 people shows a slight positive correlation between the proportion of Immigrants from Costa Rica and unemploymnet rate among females in the United States with a correlation coefficient (R) of 0.094 and weighted average of 5.4%, a difference of 12.6%.
Female Unemployment Correlation Summary
| Measurement | Chippewa | Immigrants from Costa Rica |
| Minimum | 0.60% | 1.1% |
| Maximum | 41.6% | 13.0% |
| Range | 41.0% | 11.9% |
| Mean | 11.2% | 5.4% |
| Median | 7.2% | 5.2% |
| Interquartile 25% (IQ1) | 5.1% | 4.0% |
| Interquartile 75% (IQ3) | 14.4% | 6.3% |
| Interquartile Range (IQR) | 9.3% | 2.4% |
| Standard Deviation (Sample) | 10.3% | 2.6% |
| Standard Deviation (Population) | 10.2% | 2.6% |
Similar Demographics by Female Unemployment
Demographics Similar to Chippewa by Female Unemployment
In terms of female unemployment, the demographic groups most similar to Chippewa are Immigrants from Cabo Verde (6.1%, a difference of 0.030%), Immigrants from Guatemala (6.1%, a difference of 0.030%), Haitian (6.1%, a difference of 0.070%), Trinidadian and Tobagonian (6.1%, a difference of 0.080%), and Immigrants from Caribbean (6.1%, a difference of 0.14%).
| Demographics | Rating | Rank | Female Unemployment |
| Armenians | 0.0 /100 | #279 | Tragic 6.0% |
| Mexican American Indians | 0.0 /100 | #280 | Tragic 6.0% |
| Guatemalans | 0.0 /100 | #281 | Tragic 6.0% |
| Colville | 0.0 /100 | #282 | Tragic 6.0% |
| Salvadorans | 0.0 /100 | #283 | Tragic 6.0% |
| Immigrants | Senegal | 0.0 /100 | #284 | Tragic 6.1% |
| Immigrants | Cabo Verde | 0.0 /100 | #285 | Tragic 6.1% |
| Chippewa | 0.0 /100 | #286 | Tragic 6.1% |
| Immigrants | Guatemala | 0.0 /100 | #287 | Tragic 6.1% |
| Haitians | 0.0 /100 | #288 | Tragic 6.1% |
| Trinidadians and Tobagonians | 0.0 /100 | #289 | Tragic 6.1% |
| Immigrants | Caribbean | 0.0 /100 | #290 | Tragic 6.1% |
| Immigrants | West Indies | 0.0 /100 | #291 | Tragic 6.1% |
| Immigrants | Trinidad and Tobago | 0.0 /100 | #292 | Tragic 6.1% |
| Mexicans | 0.0 /100 | #293 | Tragic 6.1% |
Demographics Similar to Immigrants from Costa Rica by Female Unemployment
In terms of female unemployment, the demographic groups most similar to Immigrants from Costa Rica are Korean (5.4%, a difference of 0.040%), Creek (5.4%, a difference of 0.19%), Choctaw (5.4%, a difference of 0.19%), Ottawa (5.4%, a difference of 0.29%), and Uruguayan (5.4%, a difference of 0.31%).
| Demographics | Rating | Rank | Female Unemployment |
| Immigrants | Middle Africa | 20.8 /100 | #201 | Fair 5.4% |
| Iroquois | 20.8 /100 | #202 | Fair 5.4% |
| Immigrants | South Eastern Asia | 20.3 /100 | #203 | Fair 5.4% |
| Immigrants | Israel | 19.7 /100 | #204 | Poor 5.4% |
| Immigrants | Afghanistan | 18.9 /100 | #205 | Poor 5.4% |
| Immigrants | Brazil | 18.8 /100 | #206 | Poor 5.4% |
| Creek | 15.4 /100 | #207 | Poor 5.4% |
| Immigrants | Costa Rica | 13.7 /100 | #208 | Poor 5.4% |
| Koreans | 13.4 /100 | #209 | Poor 5.4% |
| Choctaw | 12.3 /100 | #210 | Poor 5.4% |
| Ottawa | 11.6 /100 | #211 | Poor 5.4% |
| Uruguayans | 11.4 /100 | #212 | Poor 5.4% |
| Samoans | 10.6 /100 | #213 | Poor 5.4% |
| Seminole | 10.3 /100 | #214 | Poor 5.4% |
| Immigrants | Nicaragua | 10.2 /100 | #215 | Poor 5.4% |