Chippewa vs Immigrants from West Indies Disability
COMPARE
Chippewa
Immigrants from West Indies
Disability
Disability Comparison
Chippewa
Immigrants from West Indies
14.1%
DISABILITY
0.0/ 100
METRIC RATING
324th/ 347
METRIC RANK
11.9%
DISABILITY
21.1/ 100
METRIC RATING
190th/ 347
METRIC RANK
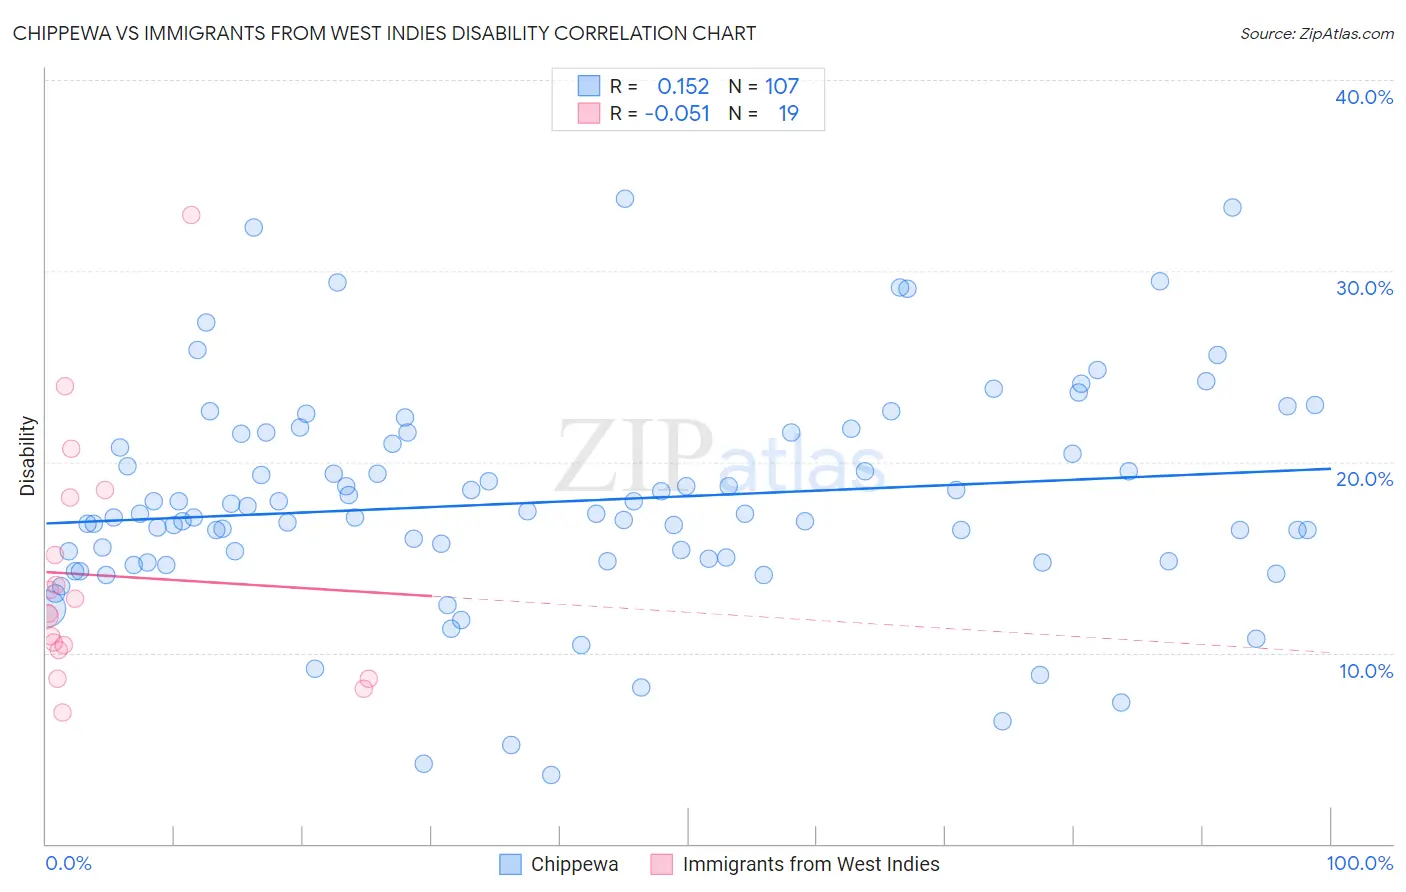
Chippewa vs Immigrants from West Indies Disability Correlation Chart
The statistical analysis conducted on geographies consisting of 215,047,919 people shows a poor positive correlation between the proportion of Chippewa and percentage of population with a disability in the United States with a correlation coefficient (R) of 0.152 and weighted average of 14.1%. Similarly, the statistical analysis conducted on geographies consisting of 72,456,461 people shows a slight negative correlation between the proportion of Immigrants from West Indies and percentage of population with a disability in the United States with a correlation coefficient (R) of -0.051 and weighted average of 11.9%, a difference of 19.2%.
Disability Correlation Summary
| Measurement | Chippewa | Immigrants from West Indies |
| Minimum | 3.6% | 6.9% |
| Maximum | 33.8% | 32.9% |
| Range | 30.2% | 26.0% |
| Mean | 17.9% | 14.1% |
| Median | 17.3% | 12.0% |
| Interquartile 25% (IQ1) | 14.8% | 10.1% |
| Interquartile 75% (IQ3) | 21.5% | 18.1% |
| Interquartile Range (IQR) | 6.7% | 8.0% |
| Standard Deviation (Sample) | 5.7% | 6.4% |
| Standard Deviation (Population) | 5.7% | 6.3% |
Similar Demographics by Disability
Demographics Similar to Chippewa by Disability
In terms of disability, the demographic groups most similar to Chippewa are Native/Alaskan (14.2%, a difference of 0.050%), Osage (14.2%, a difference of 0.080%), Ottawa (14.2%, a difference of 0.10%), Immigrants from the Azores (14.2%, a difference of 0.10%), and Comanche (14.1%, a difference of 0.20%).
| Demographics | Rating | Rank | Disability |
| Immigrants | Cabo Verde | 0.0 /100 | #317 | Tragic 13.7% |
| Menominee | 0.0 /100 | #318 | Tragic 13.8% |
| Iroquois | 0.0 /100 | #319 | Tragic 13.8% |
| Apache | 0.0 /100 | #320 | Tragic 13.9% |
| Paiute | 0.0 /100 | #321 | Tragic 13.9% |
| Americans | 0.0 /100 | #322 | Tragic 13.9% |
| Comanche | 0.0 /100 | #323 | Tragic 14.1% |
| Chippewa | 0.0 /100 | #324 | Tragic 14.1% |
| Natives/Alaskans | 0.0 /100 | #325 | Tragic 14.2% |
| Osage | 0.0 /100 | #326 | Tragic 14.2% |
| Ottawa | 0.0 /100 | #327 | Tragic 14.2% |
| Immigrants | Azores | 0.0 /100 | #328 | Tragic 14.2% |
| Potawatomi | 0.0 /100 | #329 | Tragic 14.2% |
| Navajo | 0.0 /100 | #330 | Tragic 14.3% |
| Alaskan Athabascans | 0.0 /100 | #331 | Tragic 14.4% |
Demographics Similar to Immigrants from West Indies by Disability
In terms of disability, the demographic groups most similar to Immigrants from West Indies are Immigrants from Zaire (11.9%, a difference of 0.050%), Ute (11.9%, a difference of 0.11%), Lithuanian (11.9%, a difference of 0.16%), Immigrants from Mexico (11.9%, a difference of 0.17%), and Immigrants from Bosnia and Herzegovina (11.9%, a difference of 0.21%).
| Demographics | Rating | Rank | Disability |
| Hondurans | 31.2 /100 | #183 | Fair 11.8% |
| Iraqis | 30.0 /100 | #184 | Fair 11.8% |
| Immigrants | Burma/Myanmar | 28.5 /100 | #185 | Fair 11.8% |
| Immigrants | Scotland | 28.2 /100 | #186 | Fair 11.8% |
| Lebanese | 27.9 /100 | #187 | Fair 11.8% |
| Immigrants | Mexico | 23.8 /100 | #188 | Fair 11.9% |
| Immigrants | Zaire | 21.8 /100 | #189 | Fair 11.9% |
| Immigrants | West Indies | 21.1 /100 | #190 | Fair 11.9% |
| Ute | 19.5 /100 | #191 | Poor 11.9% |
| Lithuanians | 18.8 /100 | #192 | Poor 11.9% |
| Immigrants | Bosnia and Herzegovina | 18.0 /100 | #193 | Poor 11.9% |
| Somalis | 17.3 /100 | #194 | Poor 11.9% |
| Barbadians | 15.8 /100 | #195 | Poor 11.9% |
| Serbians | 15.4 /100 | #196 | Poor 11.9% |
| Immigrants | Belize | 15.2 /100 | #197 | Poor 11.9% |