Chippewa vs Australian Female Unemployment
COMPARE
Chippewa
Australian
Female Unemployment
Female Unemployment Comparison
Chippewa
Australians
6.1%
FEMALE UNEMPLOYMENT
0.0/ 100
METRIC RATING
286th/ 347
METRIC RANK
4.9%
FEMALE UNEMPLOYMENT
99.2/ 100
METRIC RATING
49th/ 347
METRIC RANK
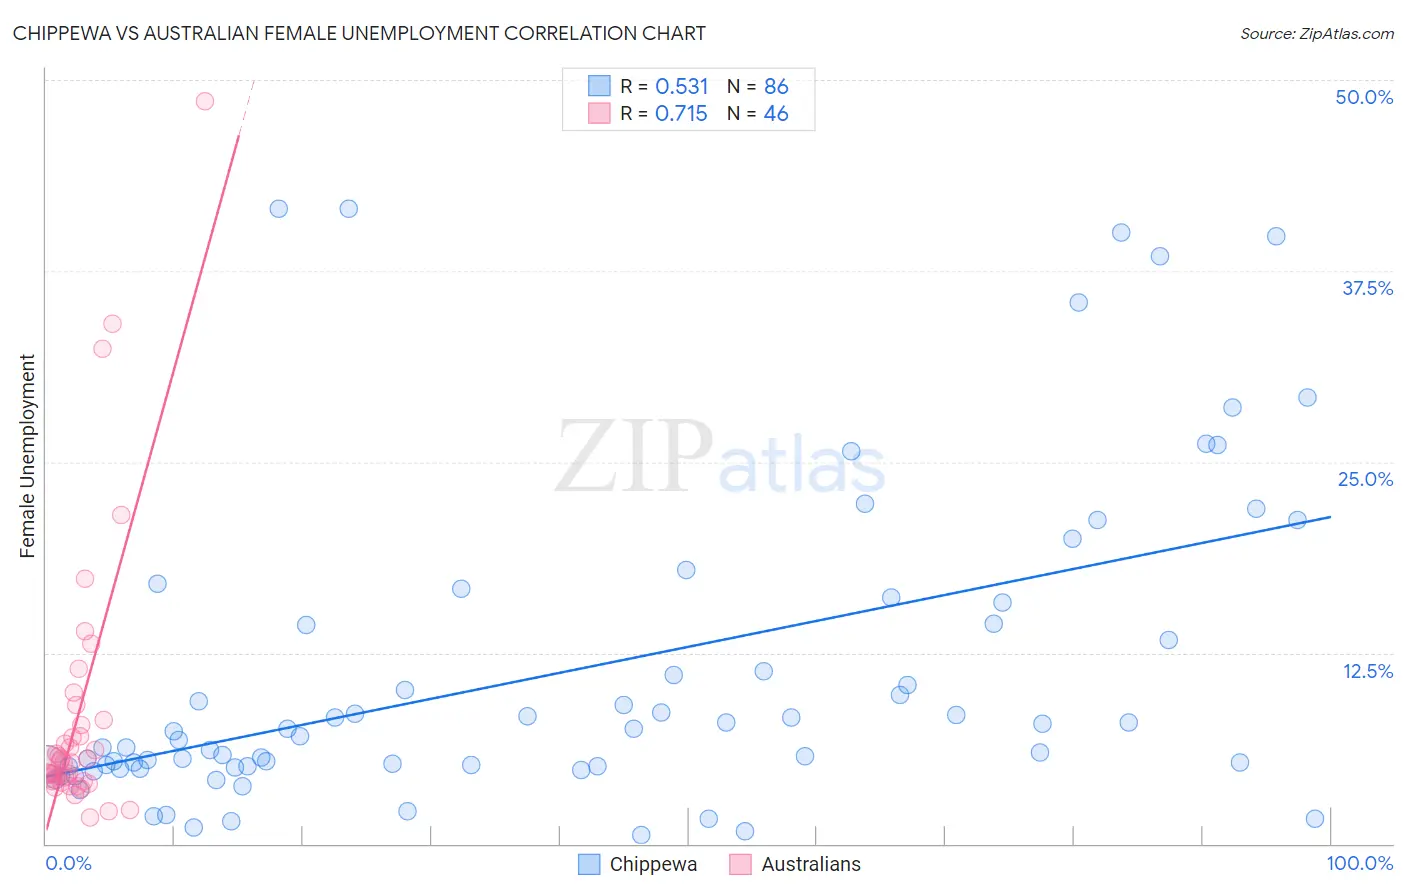
Chippewa vs Australian Female Unemployment Correlation Chart
The statistical analysis conducted on geographies consisting of 213,753,903 people shows a substantial positive correlation between the proportion of Chippewa and unemploymnet rate among females in the United States with a correlation coefficient (R) of 0.531 and weighted average of 6.1%. Similarly, the statistical analysis conducted on geographies consisting of 223,483,579 people shows a strong positive correlation between the proportion of Australians and unemploymnet rate among females in the United States with a correlation coefficient (R) of 0.715 and weighted average of 4.9%, a difference of 24.8%.
Female Unemployment Correlation Summary
| Measurement | Chippewa | Australian |
| Minimum | 0.60% | 1.7% |
| Maximum | 41.6% | 48.6% |
| Range | 41.0% | 46.9% |
| Mean | 11.2% | 8.4% |
| Median | 7.2% | 5.3% |
| Interquartile 25% (IQ1) | 5.1% | 4.1% |
| Interquartile 75% (IQ3) | 14.4% | 7.8% |
| Interquartile Range (IQR) | 9.3% | 3.7% |
| Standard Deviation (Sample) | 10.3% | 9.1% |
| Standard Deviation (Population) | 10.2% | 9.0% |
Similar Demographics by Female Unemployment
Demographics Similar to Chippewa by Female Unemployment
In terms of female unemployment, the demographic groups most similar to Chippewa are Immigrants from Cabo Verde (6.1%, a difference of 0.030%), Immigrants from Guatemala (6.1%, a difference of 0.030%), Haitian (6.1%, a difference of 0.070%), Trinidadian and Tobagonian (6.1%, a difference of 0.080%), and Immigrants from Caribbean (6.1%, a difference of 0.14%).
| Demographics | Rating | Rank | Female Unemployment |
| Armenians | 0.0 /100 | #279 | Tragic 6.0% |
| Mexican American Indians | 0.0 /100 | #280 | Tragic 6.0% |
| Guatemalans | 0.0 /100 | #281 | Tragic 6.0% |
| Colville | 0.0 /100 | #282 | Tragic 6.0% |
| Salvadorans | 0.0 /100 | #283 | Tragic 6.0% |
| Immigrants | Senegal | 0.0 /100 | #284 | Tragic 6.1% |
| Immigrants | Cabo Verde | 0.0 /100 | #285 | Tragic 6.1% |
| Chippewa | 0.0 /100 | #286 | Tragic 6.1% |
| Immigrants | Guatemala | 0.0 /100 | #287 | Tragic 6.1% |
| Haitians | 0.0 /100 | #288 | Tragic 6.1% |
| Trinidadians and Tobagonians | 0.0 /100 | #289 | Tragic 6.1% |
| Immigrants | Caribbean | 0.0 /100 | #290 | Tragic 6.1% |
| Immigrants | West Indies | 0.0 /100 | #291 | Tragic 6.1% |
| Immigrants | Trinidad and Tobago | 0.0 /100 | #292 | Tragic 6.1% |
| Mexicans | 0.0 /100 | #293 | Tragic 6.1% |
Demographics Similar to Australians by Female Unemployment
In terms of female unemployment, the demographic groups most similar to Australians are Thai (4.9%, a difference of 0.0%), Okinawan (4.9%, a difference of 0.21%), Immigrants from Cuba (4.9%, a difference of 0.24%), Cambodian (4.9%, a difference of 0.25%), and Slavic (4.9%, a difference of 0.27%).
| Demographics | Rating | Rank | Female Unemployment |
| Italians | 99.5 /100 | #42 | Exceptional 4.8% |
| Eastern Europeans | 99.4 /100 | #43 | Exceptional 4.9% |
| Greeks | 99.4 /100 | #44 | Exceptional 4.9% |
| Austrians | 99.3 /100 | #45 | Exceptional 4.9% |
| Immigrants | Bulgaria | 99.3 /100 | #46 | Exceptional 4.9% |
| Okinawans | 99.3 /100 | #47 | Exceptional 4.9% |
| Thais | 99.2 /100 | #48 | Exceptional 4.9% |
| Australians | 99.2 /100 | #49 | Exceptional 4.9% |
| Immigrants | Cuba | 99.1 /100 | #50 | Exceptional 4.9% |
| Cambodians | 99.1 /100 | #51 | Exceptional 4.9% |
| Slavs | 99.1 /100 | #52 | Exceptional 4.9% |
| Whites/Caucasians | 99.0 /100 | #53 | Exceptional 4.9% |
| Immigrants | Zimbabwe | 99.0 /100 | #54 | Exceptional 4.9% |
| Immigrants | Moldova | 99.0 /100 | #55 | Exceptional 4.9% |
| Serbians | 99.0 /100 | #56 | Exceptional 4.9% |