Nepalese vs Immigrants from West Indies Female Unemployment
COMPARE
Nepalese
Immigrants from West Indies
Female Unemployment
Female Unemployment Comparison
Nepalese
Immigrants from West Indies
5.9%
FEMALE UNEMPLOYMENT
0.0/ 100
METRIC RATING
267th/ 347
METRIC RANK
6.1%
FEMALE UNEMPLOYMENT
0.0/ 100
METRIC RATING
291st/ 347
METRIC RANK
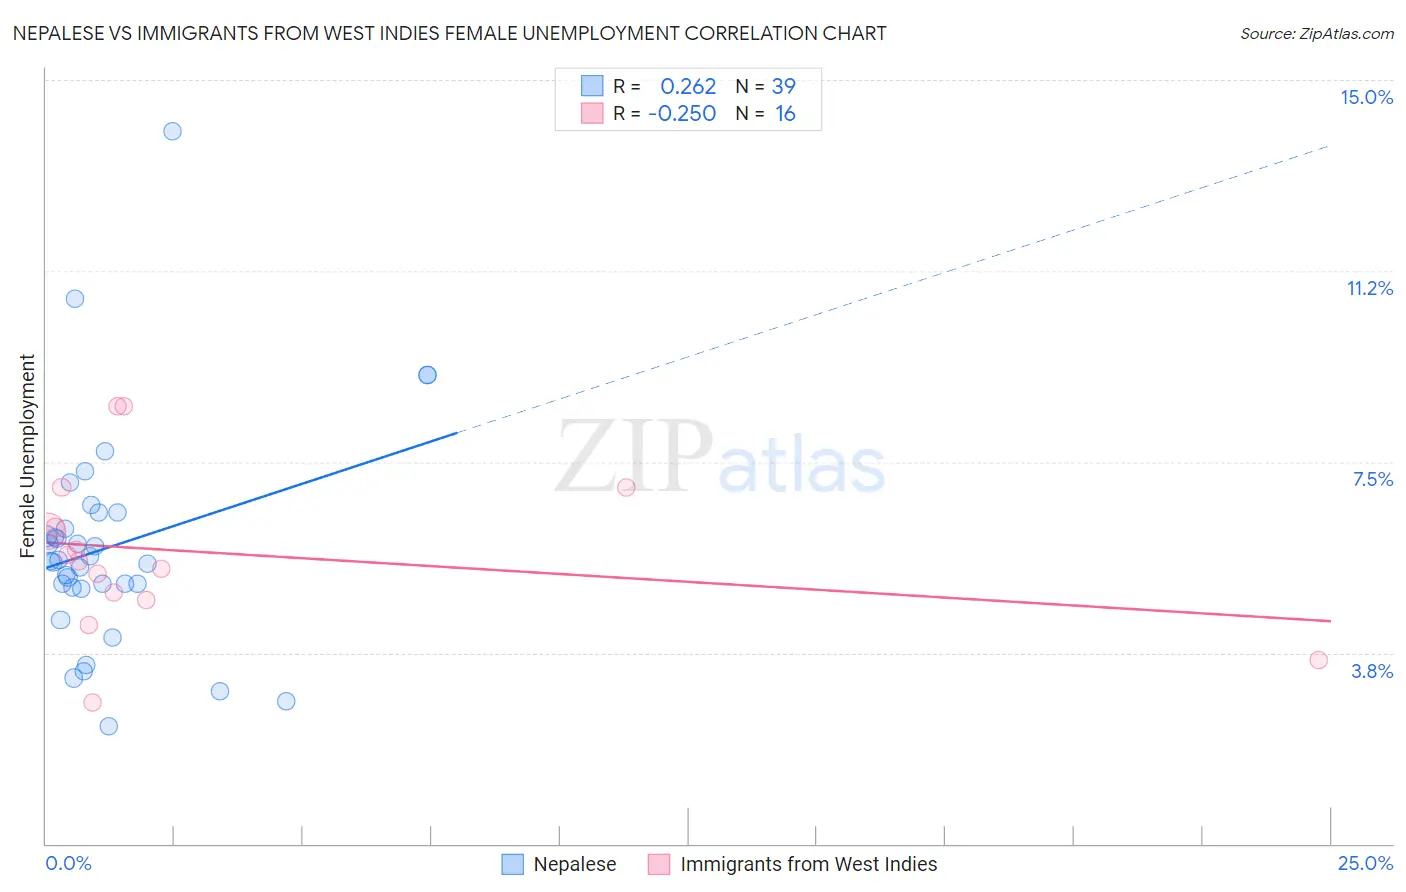
Nepalese vs Immigrants from West Indies Female Unemployment Correlation Chart
The statistical analysis conducted on geographies consisting of 24,519,269 people shows a weak positive correlation between the proportion of Nepalese and unemploymnet rate among females in the United States with a correlation coefficient (R) of 0.262 and weighted average of 5.9%. Similarly, the statistical analysis conducted on geographies consisting of 72,427,416 people shows a weak negative correlation between the proportion of Immigrants from West Indies and unemploymnet rate among females in the United States with a correlation coefficient (R) of -0.250 and weighted average of 6.1%, a difference of 3.6%.
Female Unemployment Correlation Summary
| Measurement | Nepalese | Immigrants from West Indies |
| Minimum | 2.3% | 2.8% |
| Maximum | 14.0% | 8.6% |
| Range | 11.7% | 5.8% |
| Mean | 5.8% | 5.7% |
| Median | 5.5% | 5.6% |
| Interquartile 25% (IQ1) | 5.0% | 4.9% |
| Interquartile 75% (IQ3) | 6.5% | 6.6% |
| Interquartile Range (IQR) | 1.5% | 1.8% |
| Standard Deviation (Sample) | 2.2% | 1.6% |
| Standard Deviation (Population) | 2.1% | 1.5% |
Similar Demographics by Female Unemployment
Demographics Similar to Nepalese by Female Unemployment
In terms of female unemployment, the demographic groups most similar to Nepalese are Honduran (5.9%, a difference of 0.10%), Cape Verdean (5.9%, a difference of 0.11%), Immigrants from Western Africa (5.9%, a difference of 0.30%), Blackfeet (5.9%, a difference of 0.39%), and Immigrants from Honduras (5.9%, a difference of 0.71%).
| Demographics | Rating | Rank | Female Unemployment |
| Nigerians | 0.2 /100 | #260 | Tragic 5.8% |
| Kiowa | 0.1 /100 | #261 | Tragic 5.8% |
| Immigrants | Nigeria | 0.1 /100 | #262 | Tragic 5.8% |
| Immigrants | Azores | 0.1 /100 | #263 | Tragic 5.8% |
| Immigrants | Bahamas | 0.1 /100 | #264 | Tragic 5.8% |
| Blackfeet | 0.0 /100 | #265 | Tragic 5.9% |
| Cape Verdeans | 0.0 /100 | #266 | Tragic 5.9% |
| Nepalese | 0.0 /100 | #267 | Tragic 5.9% |
| Hondurans | 0.0 /100 | #268 | Tragic 5.9% |
| Immigrants | Western Africa | 0.0 /100 | #269 | Tragic 5.9% |
| Immigrants | Honduras | 0.0 /100 | #270 | Tragic 5.9% |
| Central Americans | 0.0 /100 | #271 | Tragic 5.9% |
| Lumbee | 0.0 /100 | #272 | Tragic 5.9% |
| Ghanaians | 0.0 /100 | #273 | Tragic 5.9% |
| Africans | 0.0 /100 | #274 | Tragic 5.9% |
Demographics Similar to Immigrants from West Indies by Female Unemployment
In terms of female unemployment, the demographic groups most similar to Immigrants from West Indies are Immigrants from Trinidad and Tobago (6.1%, a difference of 0.060%), Immigrants from Caribbean (6.1%, a difference of 0.11%), Mexican (6.1%, a difference of 0.15%), Trinidadian and Tobagonian (6.1%, a difference of 0.17%), and Haitian (6.1%, a difference of 0.18%).
| Demographics | Rating | Rank | Female Unemployment |
| Immigrants | Senegal | 0.0 /100 | #284 | Tragic 6.1% |
| Immigrants | Cabo Verde | 0.0 /100 | #285 | Tragic 6.1% |
| Chippewa | 0.0 /100 | #286 | Tragic 6.1% |
| Immigrants | Guatemala | 0.0 /100 | #287 | Tragic 6.1% |
| Haitians | 0.0 /100 | #288 | Tragic 6.1% |
| Trinidadians and Tobagonians | 0.0 /100 | #289 | Tragic 6.1% |
| Immigrants | Caribbean | 0.0 /100 | #290 | Tragic 6.1% |
| Immigrants | West Indies | 0.0 /100 | #291 | Tragic 6.1% |
| Immigrants | Trinidad and Tobago | 0.0 /100 | #292 | Tragic 6.1% |
| Mexicans | 0.0 /100 | #293 | Tragic 6.1% |
| Immigrants | El Salvador | 0.0 /100 | #294 | Tragic 6.1% |
| Immigrants | Latin America | 0.0 /100 | #295 | Tragic 6.1% |
| Alaskan Athabascans | 0.0 /100 | #296 | Tragic 6.1% |
| West Indians | 0.0 /100 | #297 | Tragic 6.1% |
| Jamaicans | 0.0 /100 | #298 | Tragic 6.1% |