Chippewa vs Immigrants from West Indies Householder Income Ages 25 - 44 years
COMPARE
Chippewa
Immigrants from West Indies
Householder Income Ages 25 - 44 years
Householder Income Ages 25 - 44 years Comparison
Chippewa
Immigrants from West Indies
$80,005
HOUSEHOLDER INCOME AGES 25 - 44 YEARS
0.0/ 100
METRIC RATING
309th/ 347
METRIC RANK
$87,063
HOUSEHOLDER INCOME AGES 25 - 44 YEARS
1.5/ 100
METRIC RATING
243rd/ 347
METRIC RANK
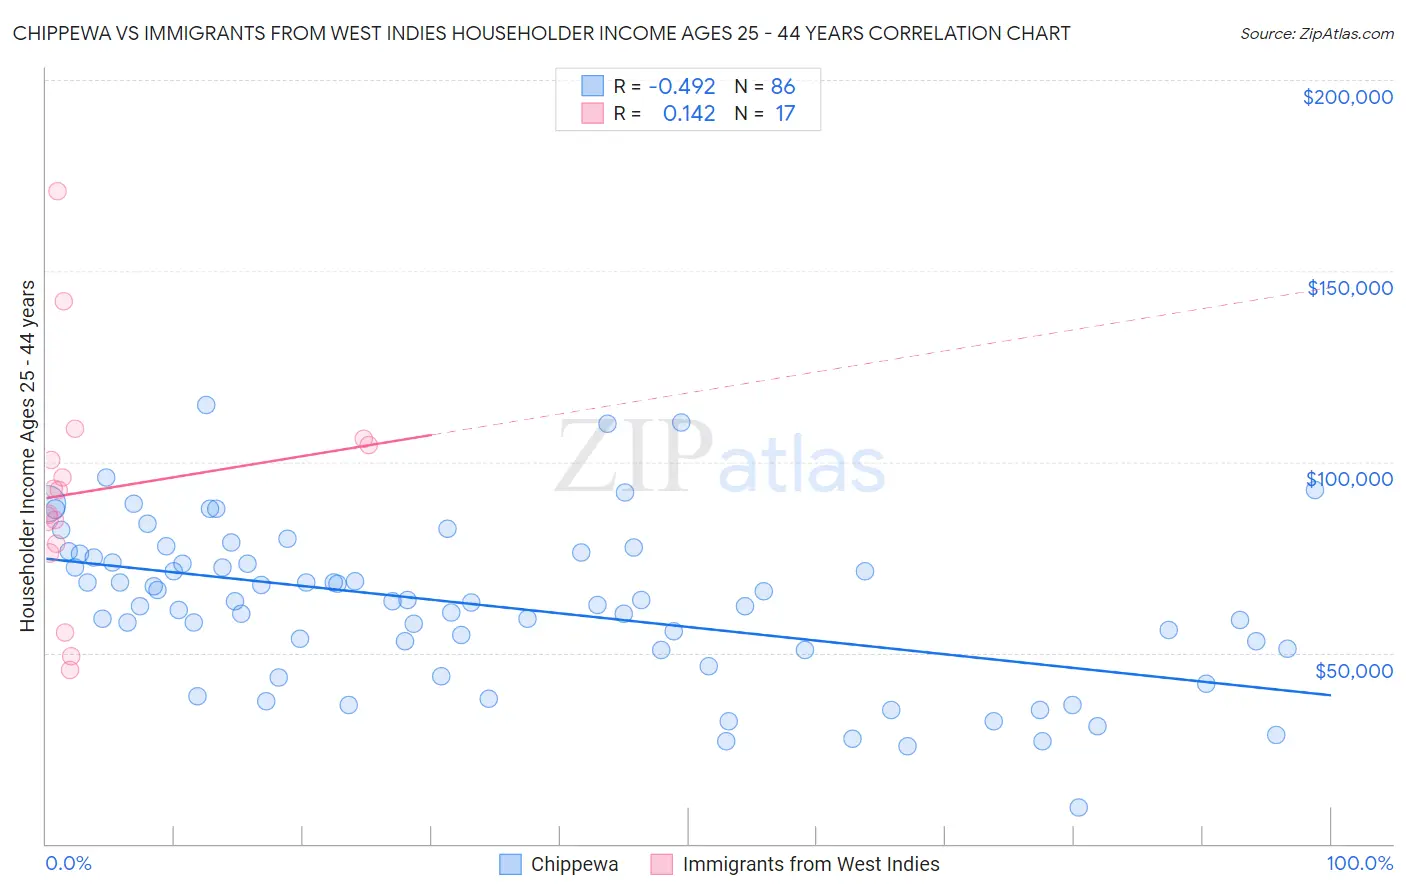
Chippewa vs Immigrants from West Indies Householder Income Ages 25 - 44 years Correlation Chart
The statistical analysis conducted on geographies consisting of 214,656,590 people shows a moderate negative correlation between the proportion of Chippewa and household income with householder between the ages 25 and 44 in the United States with a correlation coefficient (R) of -0.492 and weighted average of $80,005. Similarly, the statistical analysis conducted on geographies consisting of 72,445,724 people shows a poor positive correlation between the proportion of Immigrants from West Indies and household income with householder between the ages 25 and 44 in the United States with a correlation coefficient (R) of 0.142 and weighted average of $87,063, a difference of 8.8%.
Householder Income Ages 25 - 44 years Correlation Summary
| Measurement | Chippewa | Immigrants from West Indies |
| Minimum | $9,500 | $45,500 |
| Maximum | $114,792 | $170,707 |
| Range | $105,292 | $125,207 |
| Mean | $62,281 | $92,620 |
| Median | $63,204 | $92,679 |
| Interquartile 25% (IQ1) | $50,634 | $77,312 |
| Interquartile 75% (IQ3) | $75,056 | $105,207 |
| Interquartile Range (IQR) | $24,422 | $27,895 |
| Standard Deviation (Sample) | $20,701 | $30,962 |
| Standard Deviation (Population) | $20,580 | $30,037 |
Similar Demographics by Householder Income Ages 25 - 44 years
Demographics Similar to Chippewa by Householder Income Ages 25 - 44 years
In terms of householder income ages 25 - 44 years, the demographic groups most similar to Chippewa are Immigrants from Central America ($80,012, a difference of 0.010%), Haitian ($80,055, a difference of 0.060%), Fijian ($79,956, a difference of 0.060%), Apache ($80,260, a difference of 0.32%), and Immigrants from Dominican Republic ($80,319, a difference of 0.39%).
| Demographics | Rating | Rank | Householder Income Ages 25 - 44 years |
| Hispanics or Latinos | 0.0 /100 | #302 | Tragic $80,515 |
| Mexicans | 0.0 /100 | #303 | Tragic $80,427 |
| Immigrants | Caribbean | 0.0 /100 | #304 | Tragic $80,326 |
| Immigrants | Dominican Republic | 0.0 /100 | #305 | Tragic $80,319 |
| Apache | 0.0 /100 | #306 | Tragic $80,260 |
| Haitians | 0.0 /100 | #307 | Tragic $80,055 |
| Immigrants | Central America | 0.0 /100 | #308 | Tragic $80,012 |
| Chippewa | 0.0 /100 | #309 | Tragic $80,005 |
| Fijians | 0.0 /100 | #310 | Tragic $79,956 |
| Indonesians | 0.0 /100 | #311 | Tragic $79,543 |
| Immigrants | Haiti | 0.0 /100 | #312 | Tragic $79,391 |
| Menominee | 0.0 /100 | #313 | Tragic $79,358 |
| Cheyenne | 0.0 /100 | #314 | Tragic $79,152 |
| Ottawa | 0.0 /100 | #315 | Tragic $79,012 |
| Africans | 0.0 /100 | #316 | Tragic $78,986 |
Demographics Similar to Immigrants from West Indies by Householder Income Ages 25 - 44 years
In terms of householder income ages 25 - 44 years, the demographic groups most similar to Immigrants from West Indies are Immigrants from Venezuela ($87,038, a difference of 0.030%), West Indian ($87,205, a difference of 0.16%), Immigrants from El Salvador ($86,913, a difference of 0.17%), Immigrants from Burma/Myanmar ($86,736, a difference of 0.38%), and Immigrants from Nigeria ($86,589, a difference of 0.55%).
| Demographics | Rating | Rank | Householder Income Ages 25 - 44 years |
| Immigrants | Cameroon | 2.9 /100 | #236 | Tragic $88,214 |
| Salvadorans | 2.8 /100 | #237 | Tragic $88,198 |
| Alaska Natives | 2.6 /100 | #238 | Tragic $88,018 |
| Immigrants | Ghana | 2.2 /100 | #239 | Tragic $87,760 |
| Nicaraguans | 2.2 /100 | #240 | Tragic $87,751 |
| Nigerians | 2.2 /100 | #241 | Tragic $87,730 |
| West Indians | 1.7 /100 | #242 | Tragic $87,205 |
| Immigrants | West Indies | 1.5 /100 | #243 | Tragic $87,063 |
| Immigrants | Venezuela | 1.5 /100 | #244 | Tragic $87,038 |
| Immigrants | El Salvador | 1.4 /100 | #245 | Tragic $86,913 |
| Immigrants | Burma/Myanmar | 1.3 /100 | #246 | Tragic $86,736 |
| Immigrants | Nigeria | 1.2 /100 | #247 | Tragic $86,589 |
| Immigrants | Sudan | 0.9 /100 | #248 | Tragic $86,109 |
| French American Indians | 0.8 /100 | #249 | Tragic $85,899 |
| Pennsylvania Germans | 0.8 /100 | #250 | Tragic $85,836 |