Chippewa vs Immigrants from Grenada 4th Grade
COMPARE
Chippewa
Immigrants from Grenada
4th Grade
4th Grade Comparison
Chippewa
Immigrants from Grenada
98.2%
4TH GRADE
100.0/ 100
METRIC RATING
34th/ 347
METRIC RANK
96.7%
4TH GRADE
0.0/ 100
METRIC RATING
291st/ 347
METRIC RANK
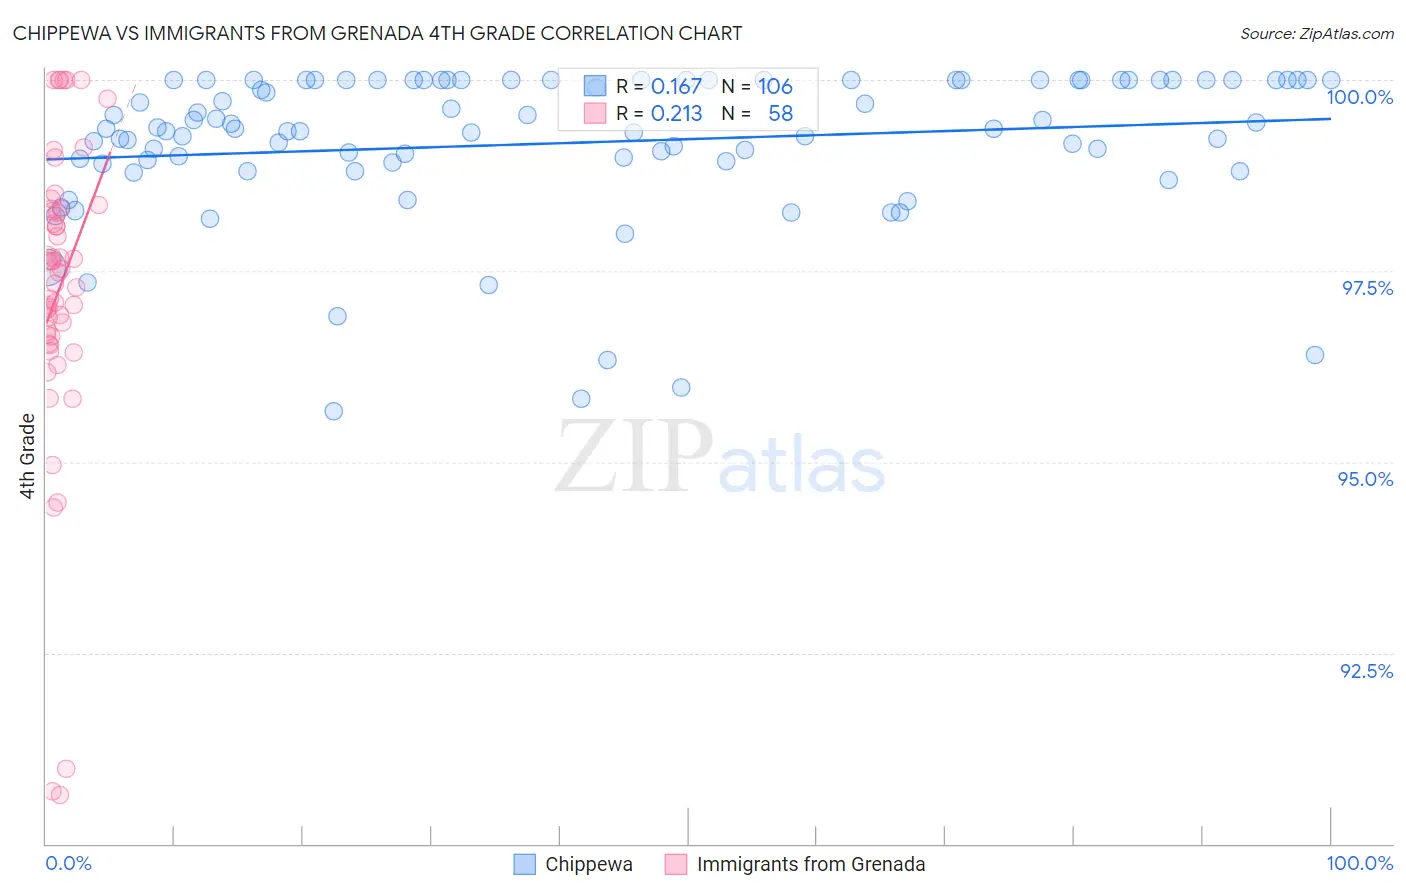
Chippewa vs Immigrants from Grenada 4th Grade Correlation Chart
The statistical analysis conducted on geographies consisting of 215,065,644 people shows a poor positive correlation between the proportion of Chippewa and percentage of population with at least 4th grade education in the United States with a correlation coefficient (R) of 0.167 and weighted average of 98.2%. Similarly, the statistical analysis conducted on geographies consisting of 67,199,790 people shows a weak positive correlation between the proportion of Immigrants from Grenada and percentage of population with at least 4th grade education in the United States with a correlation coefficient (R) of 0.213 and weighted average of 96.7%, a difference of 1.6%.
4th Grade Correlation Summary
| Measurement | Chippewa | Immigrants from Grenada |
| Minimum | 95.7% | 90.6% |
| Maximum | 100.0% | 100.0% |
| Range | 4.3% | 9.4% |
| Mean | 99.2% | 97.2% |
| Median | 99.4% | 97.5% |
| Interquartile 25% (IQ1) | 98.9% | 96.6% |
| Interquartile 75% (IQ3) | 100.0% | 98.3% |
| Interquartile Range (IQR) | 1.1% | 1.7% |
| Standard Deviation (Sample) | 0.98% | 2.0% |
| Standard Deviation (Population) | 0.98% | 2.0% |
Similar Demographics by 4th Grade
Demographics Similar to Chippewa by 4th Grade
In terms of 4th grade, the demographic groups most similar to Chippewa are Italian (98.2%, a difference of 0.0%), Swiss (98.2%, a difference of 0.010%), Chinese (98.3%, a difference of 0.020%), British (98.2%, a difference of 0.020%), and Latvian (98.2%, a difference of 0.030%).
| Demographics | Rating | Rank | 4th Grade |
| French Canadians | 100.0 /100 | #27 | Exceptional 98.3% |
| French | 100.0 /100 | #28 | Exceptional 98.3% |
| Czechs | 100.0 /100 | #29 | Exceptional 98.3% |
| Scandinavians | 100.0 /100 | #30 | Exceptional 98.3% |
| Europeans | 100.0 /100 | #31 | Exceptional 98.3% |
| Chinese | 100.0 /100 | #32 | Exceptional 98.3% |
| Swiss | 100.0 /100 | #33 | Exceptional 98.2% |
| Chippewa | 100.0 /100 | #34 | Exceptional 98.2% |
| Italians | 100.0 /100 | #35 | Exceptional 98.2% |
| British | 100.0 /100 | #36 | Exceptional 98.2% |
| Latvians | 99.9 /100 | #37 | Exceptional 98.2% |
| Aleuts | 99.9 /100 | #38 | Exceptional 98.2% |
| Belgians | 99.9 /100 | #39 | Exceptional 98.2% |
| Luxembourgers | 99.9 /100 | #40 | Exceptional 98.2% |
| Eastern Europeans | 99.9 /100 | #41 | Exceptional 98.2% |
Demographics Similar to Immigrants from Grenada by 4th Grade
In terms of 4th grade, the demographic groups most similar to Immigrants from Grenada are Malaysian (96.7%, a difference of 0.010%), British West Indian (96.7%, a difference of 0.030%), Puerto Rican (96.7%, a difference of 0.030%), Immigrants from West Indies (96.7%, a difference of 0.040%), and Immigrants from Eritrea (96.7%, a difference of 0.050%).
| Demographics | Rating | Rank | 4th Grade |
| Immigrants | St. Vincent and the Grenadines | 0.1 /100 | #284 | Tragic 96.8% |
| Immigrants | Barbados | 0.0 /100 | #285 | Tragic 96.8% |
| Immigrants | Thailand | 0.0 /100 | #286 | Tragic 96.8% |
| Houma | 0.0 /100 | #287 | Tragic 96.8% |
| Immigrants | Afghanistan | 0.0 /100 | #288 | Tragic 96.8% |
| Immigrants | West Indies | 0.0 /100 | #289 | Tragic 96.7% |
| British West Indians | 0.0 /100 | #290 | Tragic 96.7% |
| Immigrants | Grenada | 0.0 /100 | #291 | Tragic 96.7% |
| Malaysians | 0.0 /100 | #292 | Tragic 96.7% |
| Puerto Ricans | 0.0 /100 | #293 | Tragic 96.7% |
| Immigrants | Eritrea | 0.0 /100 | #294 | Tragic 96.7% |
| Immigrants | Portugal | 0.0 /100 | #295 | Tragic 96.6% |
| Somalis | 0.0 /100 | #296 | Tragic 96.6% |
| Immigrants | Somalia | 0.0 /100 | #297 | Tragic 96.5% |
| Haitians | 0.0 /100 | #298 | Tragic 96.5% |