African vs Immigrants from Grenada Female Unemployment
COMPARE
African
Immigrants from Grenada
Female Unemployment
Female Unemployment Comparison
Africans
Immigrants from Grenada
5.9%
FEMALE UNEMPLOYMENT
0.0/ 100
METRIC RATING
274th/ 347
METRIC RANK
6.3%
FEMALE UNEMPLOYMENT
0.0/ 100
METRIC RATING
312th/ 347
METRIC RANK
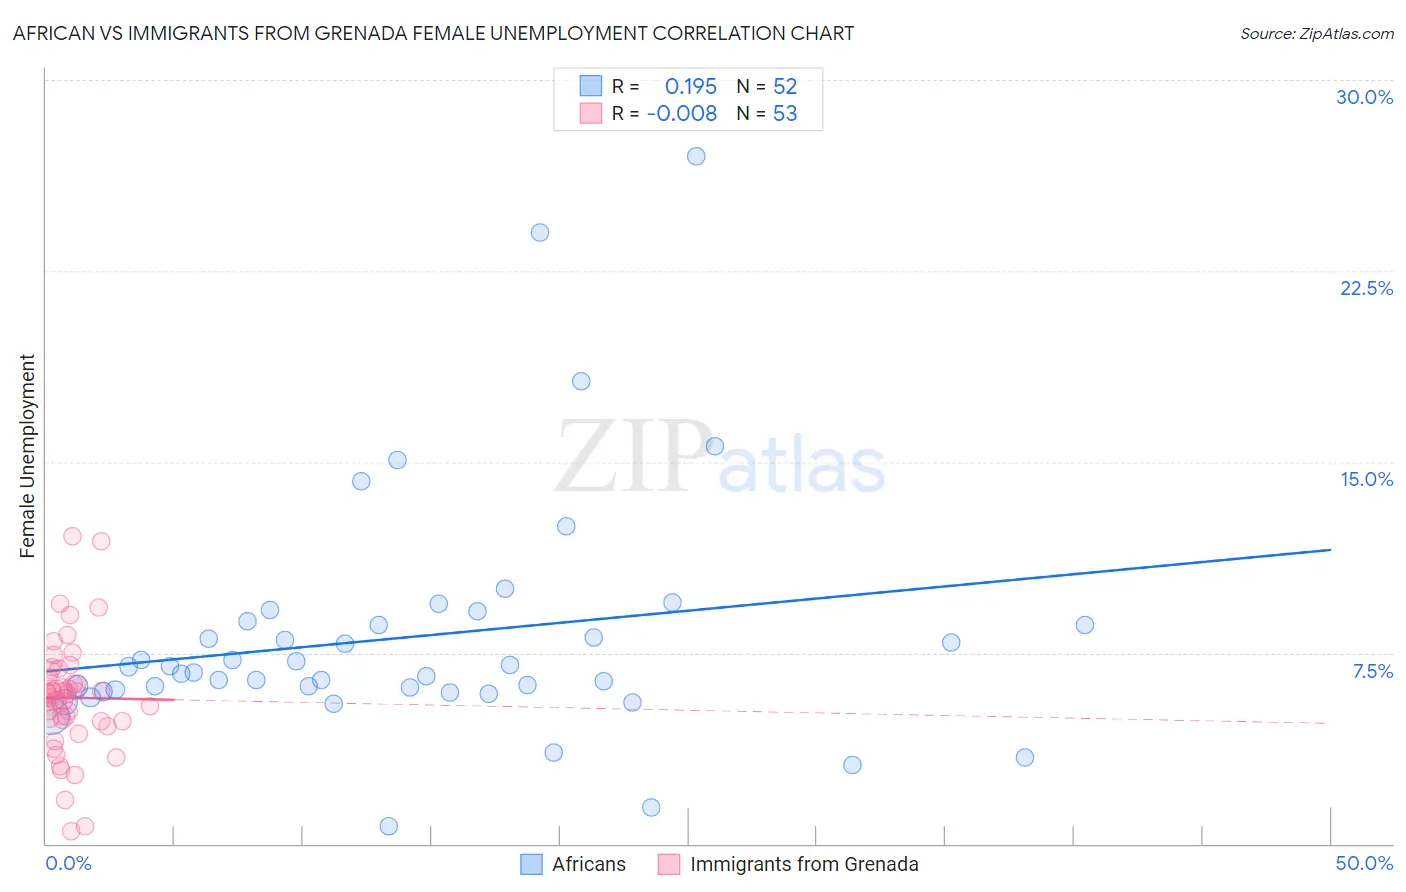
African vs Immigrants from Grenada Female Unemployment Correlation Chart
The statistical analysis conducted on geographies consisting of 467,075,487 people shows a poor positive correlation between the proportion of Africans and unemploymnet rate among females in the United States with a correlation coefficient (R) of 0.195 and weighted average of 5.9%. Similarly, the statistical analysis conducted on geographies consisting of 67,141,696 people shows no correlation between the proportion of Immigrants from Grenada and unemploymnet rate among females in the United States with a correlation coefficient (R) of -0.008 and weighted average of 6.3%, a difference of 6.6%.
Female Unemployment Correlation Summary
| Measurement | African | Immigrants from Grenada |
| Minimum | 0.68% | 0.50% |
| Maximum | 27.0% | 12.1% |
| Range | 26.3% | 11.6% |
| Mean | 8.1% | 5.7% |
| Median | 6.8% | 5.9% |
| Interquartile 25% (IQ1) | 6.0% | 4.8% |
| Interquartile 75% (IQ3) | 8.7% | 6.7% |
| Interquartile Range (IQR) | 2.7% | 1.9% |
| Standard Deviation (Sample) | 4.7% | 2.2% |
| Standard Deviation (Population) | 4.7% | 2.2% |
Similar Demographics by Female Unemployment
Demographics Similar to Africans by Female Unemployment
In terms of female unemployment, the demographic groups most similar to Africans are Ghanaian (5.9%, a difference of 0.080%), Lumbee (5.9%, a difference of 0.090%), Central American (5.9%, a difference of 0.28%), Immigrants from Honduras (5.9%, a difference of 0.38%), and Senegalese (6.0%, a difference of 0.49%).
| Demographics | Rating | Rank | Female Unemployment |
| Nepalese | 0.0 /100 | #267 | Tragic 5.9% |
| Hondurans | 0.0 /100 | #268 | Tragic 5.9% |
| Immigrants | Western Africa | 0.0 /100 | #269 | Tragic 5.9% |
| Immigrants | Honduras | 0.0 /100 | #270 | Tragic 5.9% |
| Central Americans | 0.0 /100 | #271 | Tragic 5.9% |
| Lumbee | 0.0 /100 | #272 | Tragic 5.9% |
| Ghanaians | 0.0 /100 | #273 | Tragic 5.9% |
| Africans | 0.0 /100 | #274 | Tragic 5.9% |
| Senegalese | 0.0 /100 | #275 | Tragic 6.0% |
| Bahamians | 0.0 /100 | #276 | Tragic 6.0% |
| Immigrants | Ghana | 0.0 /100 | #277 | Tragic 6.0% |
| Yaqui | 0.0 /100 | #278 | Tragic 6.0% |
| Armenians | 0.0 /100 | #279 | Tragic 6.0% |
| Mexican American Indians | 0.0 /100 | #280 | Tragic 6.0% |
| Guatemalans | 0.0 /100 | #281 | Tragic 6.0% |
Demographics Similar to Immigrants from Grenada by Female Unemployment
In terms of female unemployment, the demographic groups most similar to Immigrants from Grenada are Belizean (6.3%, a difference of 0.010%), Immigrants from Ecuador (6.4%, a difference of 0.24%), Pueblo (6.4%, a difference of 0.55%), Immigrants from Mexico (6.3%, a difference of 0.66%), and Central American Indian (6.3%, a difference of 0.79%).
| Demographics | Rating | Rank | Female Unemployment |
| Spanish American Indians | 0.0 /100 | #305 | Tragic 6.2% |
| Immigrants | Central America | 0.0 /100 | #306 | Tragic 6.2% |
| Shoshone | 0.0 /100 | #307 | Tragic 6.2% |
| Hispanics or Latinos | 0.0 /100 | #308 | Tragic 6.2% |
| Ecuadorians | 0.0 /100 | #309 | Tragic 6.3% |
| Central American Indians | 0.0 /100 | #310 | Tragic 6.3% |
| Immigrants | Mexico | 0.0 /100 | #311 | Tragic 6.3% |
| Immigrants | Grenada | 0.0 /100 | #312 | Tragic 6.3% |
| Belizeans | 0.0 /100 | #313 | Tragic 6.3% |
| Immigrants | Ecuador | 0.0 /100 | #314 | Tragic 6.4% |
| Pueblo | 0.0 /100 | #315 | Tragic 6.4% |
| Houma | 0.0 /100 | #316 | Tragic 6.4% |
| Immigrants | St. Vincent and the Grenadines | 0.0 /100 | #317 | Tragic 6.4% |
| British West Indians | 0.0 /100 | #318 | Tragic 6.4% |
| Immigrants | Bangladesh | 0.0 /100 | #319 | Tragic 6.5% |