Tsimshian vs Immigrants from Grenada Female Unemployment
COMPARE
Tsimshian
Immigrants from Grenada
Female Unemployment
Female Unemployment Comparison
Tsimshian
Immigrants from Grenada
5.4%
FEMALE UNEMPLOYMENT
23.1/ 100
METRIC RATING
198th/ 347
METRIC RANK
6.3%
FEMALE UNEMPLOYMENT
0.0/ 100
METRIC RATING
312th/ 347
METRIC RANK
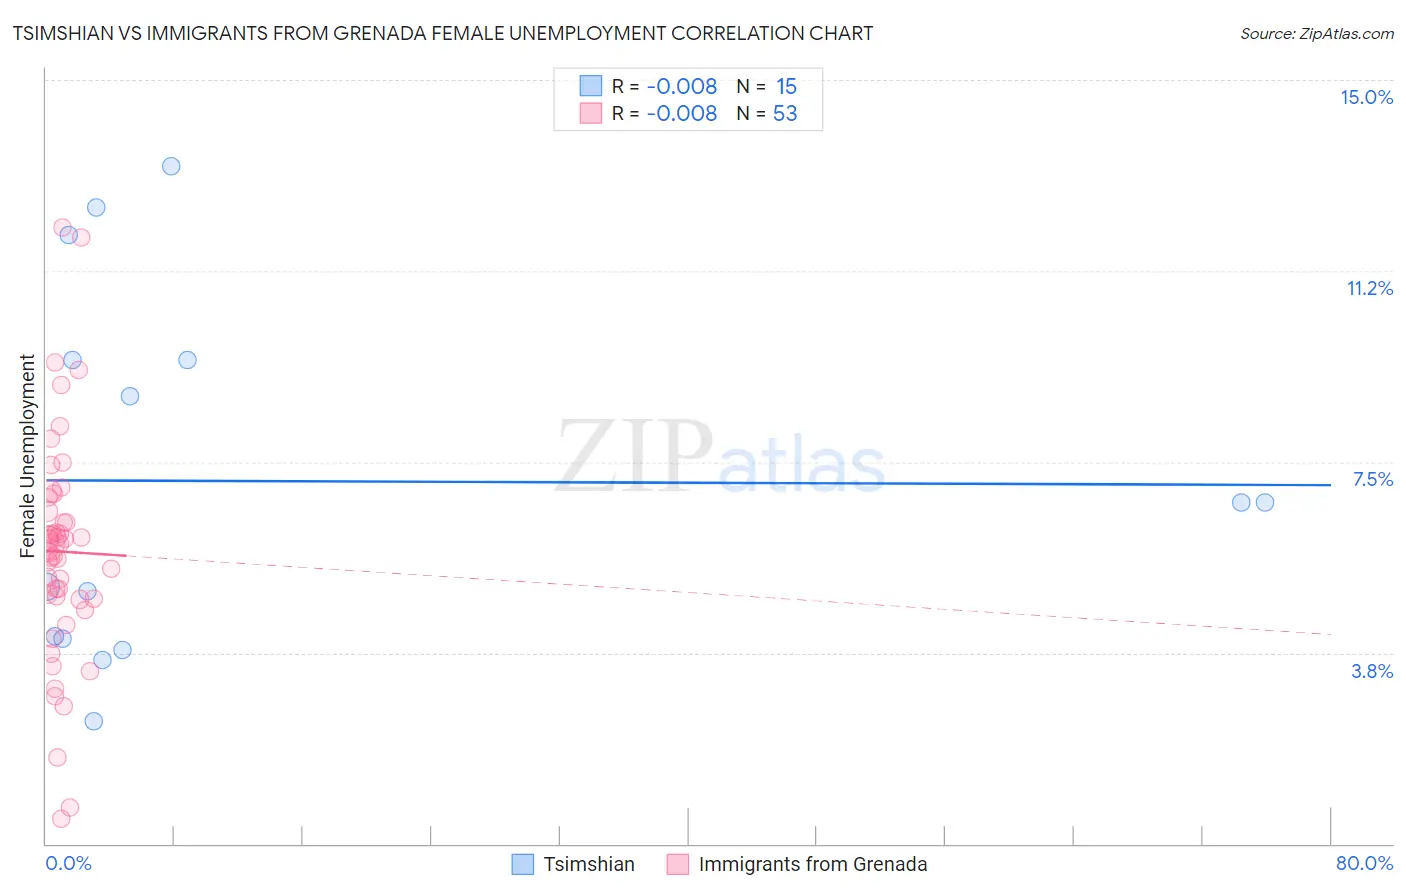
Tsimshian vs Immigrants from Grenada Female Unemployment Correlation Chart
The statistical analysis conducted on geographies consisting of 15,620,666 people shows no correlation between the proportion of Tsimshian and unemploymnet rate among females in the United States with a correlation coefficient (R) of -0.008 and weighted average of 5.4%. Similarly, the statistical analysis conducted on geographies consisting of 67,141,696 people shows no correlation between the proportion of Immigrants from Grenada and unemploymnet rate among females in the United States with a correlation coefficient (R) of -0.008 and weighted average of 6.3%, a difference of 18.5%.
Female Unemployment Correlation Summary
| Measurement | Tsimshian | Immigrants from Grenada |
| Minimum | 2.4% | 0.50% |
| Maximum | 13.3% | 12.1% |
| Range | 10.9% | 11.6% |
| Mean | 7.1% | 5.7% |
| Median | 6.7% | 5.9% |
| Interquartile 25% (IQ1) | 4.0% | 4.8% |
| Interquartile 75% (IQ3) | 9.5% | 6.7% |
| Interquartile Range (IQR) | 5.5% | 1.9% |
| Standard Deviation (Sample) | 3.6% | 2.2% |
| Standard Deviation (Population) | 3.4% | 2.2% |
Similar Demographics by Female Unemployment
Demographics Similar to Tsimshian by Female Unemployment
In terms of female unemployment, the demographic groups most similar to Tsimshian are Alsatian (5.3%, a difference of 0.070%), Hawaiian (5.4%, a difference of 0.080%), Soviet Union (5.4%, a difference of 0.12%), Spaniard (5.3%, a difference of 0.17%), and Immigrants from Middle Africa (5.4%, a difference of 0.20%).
| Demographics | Rating | Rank | Female Unemployment |
| Cherokee | 30.8 /100 | #191 | Fair 5.3% |
| Portuguese | 28.6 /100 | #192 | Fair 5.3% |
| Arabs | 27.7 /100 | #193 | Fair 5.3% |
| Colombians | 27.0 /100 | #194 | Fair 5.3% |
| Immigrants | Colombia | 26.2 /100 | #195 | Fair 5.3% |
| Spaniards | 25.2 /100 | #196 | Fair 5.3% |
| Alsatians | 23.9 /100 | #197 | Fair 5.3% |
| Tsimshian | 23.1 /100 | #198 | Fair 5.4% |
| Hawaiians | 22.2 /100 | #199 | Fair 5.4% |
| Soviet Union | 21.7 /100 | #200 | Fair 5.4% |
| Immigrants | Middle Africa | 20.8 /100 | #201 | Fair 5.4% |
| Iroquois | 20.8 /100 | #202 | Fair 5.4% |
| Immigrants | South Eastern Asia | 20.3 /100 | #203 | Fair 5.4% |
| Immigrants | Israel | 19.7 /100 | #204 | Poor 5.4% |
| Immigrants | Afghanistan | 18.9 /100 | #205 | Poor 5.4% |
Demographics Similar to Immigrants from Grenada by Female Unemployment
In terms of female unemployment, the demographic groups most similar to Immigrants from Grenada are Belizean (6.3%, a difference of 0.010%), Immigrants from Ecuador (6.4%, a difference of 0.24%), Pueblo (6.4%, a difference of 0.55%), Immigrants from Mexico (6.3%, a difference of 0.66%), and Central American Indian (6.3%, a difference of 0.79%).
| Demographics | Rating | Rank | Female Unemployment |
| Spanish American Indians | 0.0 /100 | #305 | Tragic 6.2% |
| Immigrants | Central America | 0.0 /100 | #306 | Tragic 6.2% |
| Shoshone | 0.0 /100 | #307 | Tragic 6.2% |
| Hispanics or Latinos | 0.0 /100 | #308 | Tragic 6.2% |
| Ecuadorians | 0.0 /100 | #309 | Tragic 6.3% |
| Central American Indians | 0.0 /100 | #310 | Tragic 6.3% |
| Immigrants | Mexico | 0.0 /100 | #311 | Tragic 6.3% |
| Immigrants | Grenada | 0.0 /100 | #312 | Tragic 6.3% |
| Belizeans | 0.0 /100 | #313 | Tragic 6.3% |
| Immigrants | Ecuador | 0.0 /100 | #314 | Tragic 6.4% |
| Pueblo | 0.0 /100 | #315 | Tragic 6.4% |
| Houma | 0.0 /100 | #316 | Tragic 6.4% |
| Immigrants | St. Vincent and the Grenadines | 0.0 /100 | #317 | Tragic 6.4% |
| British West Indians | 0.0 /100 | #318 | Tragic 6.4% |
| Immigrants | Bangladesh | 0.0 /100 | #319 | Tragic 6.5% |