Immigrants from El Salvador vs Immigrants from Grenada Female Unemployment
COMPARE
Immigrants from El Salvador
Immigrants from Grenada
Female Unemployment
Female Unemployment Comparison
Immigrants from El Salvador
Immigrants from Grenada
6.1%
FEMALE UNEMPLOYMENT
0.0/ 100
METRIC RATING
294th/ 347
METRIC RANK
6.3%
FEMALE UNEMPLOYMENT
0.0/ 100
METRIC RATING
312th/ 347
METRIC RANK
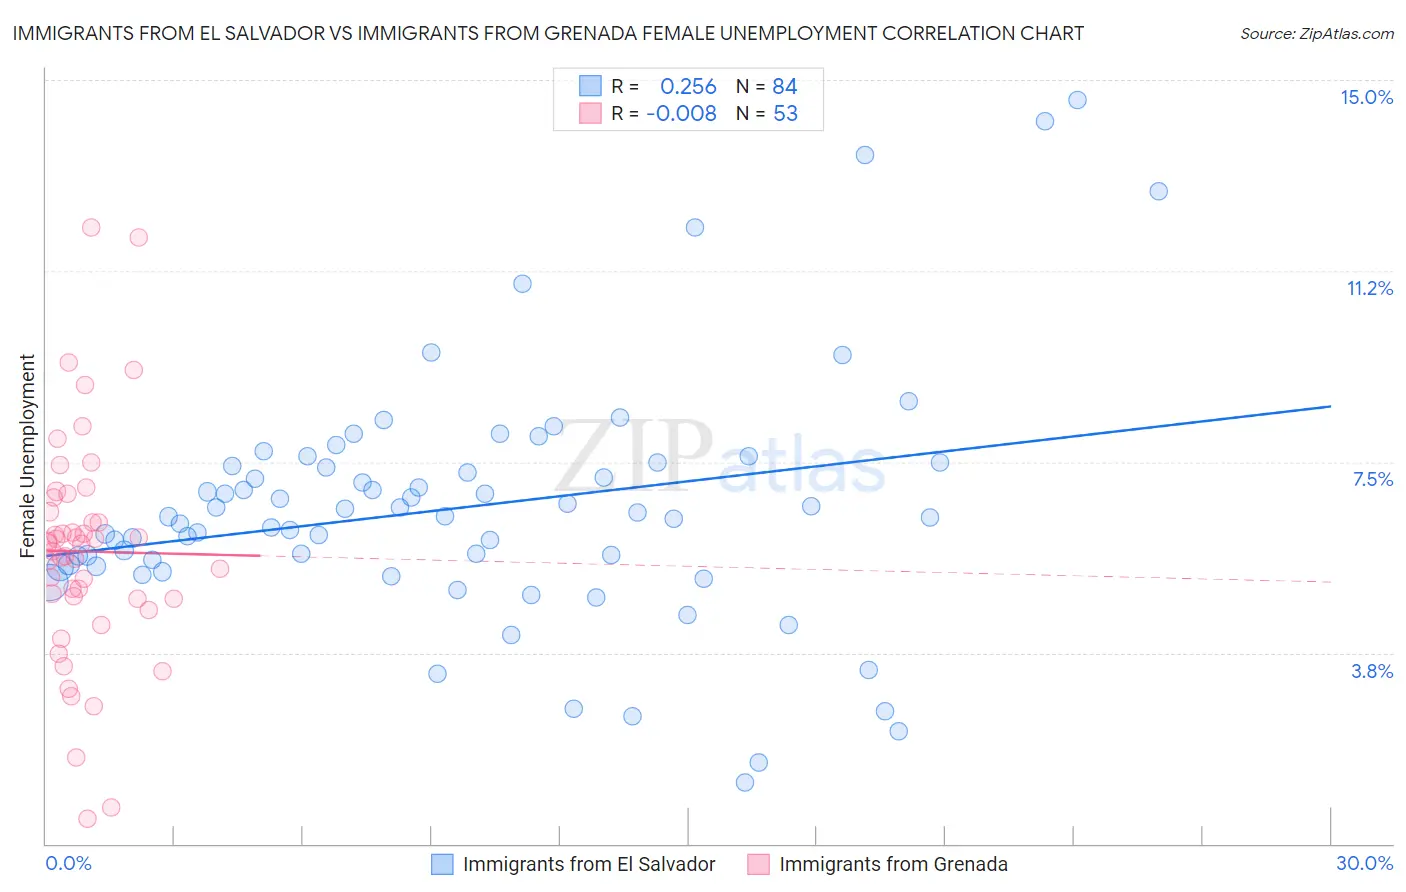
Immigrants from El Salvador vs Immigrants from Grenada Female Unemployment Correlation Chart
The statistical analysis conducted on geographies consisting of 356,565,634 people shows a weak positive correlation between the proportion of Immigrants from El Salvador and unemploymnet rate among females in the United States with a correlation coefficient (R) of 0.256 and weighted average of 6.1%. Similarly, the statistical analysis conducted on geographies consisting of 67,141,696 people shows no correlation between the proportion of Immigrants from Grenada and unemploymnet rate among females in the United States with a correlation coefficient (R) of -0.008 and weighted average of 6.3%, a difference of 3.7%.
Female Unemployment Correlation Summary
| Measurement | Immigrants from El Salvador | Immigrants from Grenada |
| Minimum | 1.2% | 0.50% |
| Maximum | 14.6% | 12.1% |
| Range | 13.4% | 11.6% |
| Mean | 6.6% | 5.7% |
| Median | 6.4% | 5.9% |
| Interquartile 25% (IQ1) | 5.5% | 4.8% |
| Interquartile 75% (IQ3) | 7.5% | 6.7% |
| Interquartile Range (IQR) | 2.0% | 1.9% |
| Standard Deviation (Sample) | 2.4% | 2.2% |
| Standard Deviation (Population) | 2.4% | 2.2% |
Demographics Similar to Immigrants from El Salvador and Immigrants from Grenada by Female Unemployment
In terms of female unemployment, the demographic groups most similar to Immigrants from El Salvador are Mexican (6.1%, a difference of 0.10%), Immigrants from Latin America (6.1%, a difference of 0.10%), Alaskan Athabascan (6.1%, a difference of 0.12%), West Indian (6.1%, a difference of 0.13%), and Jamaican (6.1%, a difference of 0.16%). Similarly, the demographic groups most similar to Immigrants from Grenada are Belizean (6.3%, a difference of 0.010%), Immigrants from Mexico (6.3%, a difference of 0.66%), Central American Indian (6.3%, a difference of 0.79%), Ecuadorian (6.3%, a difference of 1.2%), and Hispanic or Latino (6.2%, a difference of 1.8%).
| Demographics | Rating | Rank | Female Unemployment |
| Mexicans | 0.0 /100 | #293 | Tragic 6.1% |
| Immigrants | El Salvador | 0.0 /100 | #294 | Tragic 6.1% |
| Immigrants | Latin America | 0.0 /100 | #295 | Tragic 6.1% |
| Alaskan Athabascans | 0.0 /100 | #296 | Tragic 6.1% |
| West Indians | 0.0 /100 | #297 | Tragic 6.1% |
| Jamaicans | 0.0 /100 | #298 | Tragic 6.1% |
| Ute | 0.0 /100 | #299 | Tragic 6.1% |
| Immigrants | Haiti | 0.0 /100 | #300 | Tragic 6.1% |
| Immigrants | Barbados | 0.0 /100 | #301 | Tragic 6.2% |
| U.S. Virgin Islanders | 0.0 /100 | #302 | Tragic 6.2% |
| Barbadians | 0.0 /100 | #303 | Tragic 6.2% |
| Immigrants | Jamaica | 0.0 /100 | #304 | Tragic 6.2% |
| Spanish American Indians | 0.0 /100 | #305 | Tragic 6.2% |
| Immigrants | Central America | 0.0 /100 | #306 | Tragic 6.2% |
| Shoshone | 0.0 /100 | #307 | Tragic 6.2% |
| Hispanics or Latinos | 0.0 /100 | #308 | Tragic 6.2% |
| Ecuadorians | 0.0 /100 | #309 | Tragic 6.3% |
| Central American Indians | 0.0 /100 | #310 | Tragic 6.3% |
| Immigrants | Mexico | 0.0 /100 | #311 | Tragic 6.3% |
| Immigrants | Grenada | 0.0 /100 | #312 | Tragic 6.3% |
| Belizeans | 0.0 /100 | #313 | Tragic 6.3% |