Celtic vs Tongan Unemployment Among Ages 65 to 74 years

COMPARE

Celtic
Race
Ancestry
AfghanAfricanAlaska NativeAlaskan AthabascanAlbanianAleutAlsatianAmericanApacheArabArapahoArgentineanArmenianAssyrian/Chaldean/SyriacAustralianAustrianBahamianBangladeshiBarbadianBasqueBelgianBelizeanBermudanBhutaneseBlackfeetBolivianBrazilianBritishBritish West IndianBulgarianBurmeseCajunCambodianCanadianCape VerdeanCarpatho RusynCelticCentral AmericanCentral American IndianCherokeeCheyenneChickasawChileanChineseChippewaChoctawColombianColvilleComancheCosta RicanCreeCreekCroatianCrowCubanCypriotCzechCzechoslovakianDanishDelawareDominicanDutchDutch West IndianEastern EuropeanEcuadorianEgyptianEnglishEstonianEthiopianEuropeanFijianFilipinoFinnishFrenchFrench American IndianFrench CanadianGermanGerman RussianGhanaianGreekGuamanian/ChamorroGuatemalanGuyaneseHaitianHmongHonduranHopiHoumaHungarianIcelanderIndian (Asian)IndonesianInupiatIranianIraqiIrishIroquoisIsraeliItalianJamaicanJapaneseJordanianKenyanKiowaKoreanLaotianLatvianLebaneseLiberianLithuanianLumbeeLuxembourgerMacedonianMalaysianMalteseMarshalleseMenomineeMexicanMexican American IndianMongolianMoroccanNative HawaiianNavajoNepaleseNew ZealanderNicaraguanNigerianNorthern EuropeanNorwegianOkinawanOsageOttawaPaiutePakistaniPalestinianPanamanianParaguayanPennsylvania GermanPeruvianPimaPolishPortuguesePotawatomiPuebloPuerto RicanPuget Sound SalishRomanianRussianSalvadoranSamoanScandinavianScotch-IrishScottishSeminoleSenegaleseSerbianShoshoneSierra LeoneanSiouxSlavicSlovakSloveneSomaliSouth AfricanSouth AmericanSouth American IndianSoviet UnionSpaniardSpanishSpanish AmericanSpanish American IndianSri LankanSubsaharan AfricanSudaneseSwedishSwissSyrianTaiwaneseThaiTlingit-HaidaTohono O'OdhamTrinidadian and TobagonianTsimshianTurkishU.S. Virgin IslanderUgandanUkrainianUruguayanUteVenezuelanVietnameseWelshWest IndianYakamaYaquiYugoslavianYumanYup'ikZimbabwean
Immigration
NonimmigrantsImmigrantsAfghanistanAfricaAlbaniaArgentinaArmeniaAsiaAustraliaAustriaBahamasBangladeshBarbadosBelarusBelgiumBelizeBoliviaBosnia and HerzegovinaBrazilBulgariaBurma/MyanmarCabo VerdeCambodiaCameroonCanadaCaribbeanCentral AmericaChileChinaColombiaCongoCosta RicaCroatiaCubaCzechoslovakiaDenmarkDominicaDominican RepublicEastern AfricaEastern AsiaEastern EuropeEcuadorEgyptEl SalvadorEnglandEritreaEthiopiaEuropeFijiFranceGermanyGhanaGreeceGrenadaGuatemalaGuyanaHaitiHondurasHong KongHungaryIndiaIndonesiaIranIraqIrelandIsraelItalyJamaicaJapanJordanKazakhstanKenyaKoreaKuwaitLaosLatin AmericaLatviaLebanonLiberiaLithuaniaMalaysiaMexicoMicronesiaMiddle AfricaMoldovaMoroccoNepalNetherlandsNicaraguaNigeriaNorth AmericaNorth MacedoniaNorthern AfricaNorthern EuropeNorwayOceaniaPakistanPanamaPeruPhilippinesPolandPortugalRomaniaRussiaSaudi ArabiaScotlandSenegalSerbiaSierra LeoneSingaporeSomaliaSouth AfricaSouth AmericaSouth Central AsiaSouth Eastern AsiaSouthern EuropeSpainSri LankaSt. Vincent and the GrenadinesSudanSwedenSwitzerlandSyriaTaiwanThailandTrinidad and TobagoTurkeyUgandaUkraineUruguayUzbekistanVenezuelaVietnamWest IndiesWestern AfricaWestern AsiaWestern EuropeYemenZaireZimbabweAzores
Tongan
Race
Ancestry
AfghanAfricanAlaska NativeAlaskan AthabascanAlbanianAleutAlsatianAmericanApacheArabArapahoArgentineanArmenianAssyrian/Chaldean/SyriacAustralianAustrianBahamianBangladeshiBarbadianBasqueBelgianBelizeanBermudanBhutaneseBlackfeetBolivianBrazilianBritishBritish West IndianBulgarianBurmeseCajunCambodianCanadianCape VerdeanCarpatho RusynCentral AmericanCentral American IndianCherokeeCheyenneChickasawChileanChineseChippewaChoctawColombianColvilleComancheCosta RicanCreeCreekCroatianCrowCubanCypriotCzechCzechoslovakianDanishDelawareDominicanDutchDutch West IndianEastern EuropeanEcuadorianEgyptianEnglishEstonianEthiopianEuropeanFijianFilipinoFinnishFrenchFrench American IndianFrench CanadianGermanGerman RussianGhanaianGreekGuamanian/ChamorroGuatemalanGuyaneseHaitianHmongHonduranHopiHoumaHungarianIcelanderIndian (Asian)IndonesianInupiatIranianIraqiIrishIroquoisIsraeliItalianJamaicanJapaneseJordanianKenyanKiowaKoreanLaotianLatvianLebaneseLiberianLithuanianLumbeeLuxembourgerMacedonianMalaysianMalteseMarshalleseMenomineeMexicanMexican American IndianMongolianMoroccanNative HawaiianNavajoNepaleseNew ZealanderNicaraguanNigerianNorthern EuropeanNorwegianOkinawanOsageOttawaPaiutePakistaniPalestinianPanamanianParaguayanPennsylvania GermanPeruvianPimaPolishPortuguesePotawatomiPuebloPuerto RicanPuget Sound SalishRomanianRussianSalvadoranSamoanScandinavianScotch-IrishScottishSeminoleSenegaleseSerbianShoshoneSierra LeoneanSiouxSlavicSlovakSloveneSomaliSouth AfricanSouth AmericanSouth American IndianSoviet UnionSpaniardSpanishSpanish AmericanSpanish American IndianSri LankanSubsaharan AfricanSudaneseSwedishSwissSyrianTaiwaneseThaiTlingit-HaidaTohono O'OdhamTonganTrinidadian and TobagonianTsimshianTurkishU.S. Virgin IslanderUgandanUkrainianUruguayanUteVenezuelanVietnameseWelshWest IndianYakamaYaquiYugoslavianYumanYup'ikZimbabwean
Immigration
NonimmigrantsImmigrantsAfghanistanAfricaAlbaniaArgentinaArmeniaAsiaAustraliaAustriaBahamasBangladeshBarbadosBelarusBelgiumBelizeBoliviaBosnia and HerzegovinaBrazilBulgariaBurma/MyanmarCabo VerdeCambodiaCameroonCanadaCaribbeanCentral AmericaChileChinaColombiaCongoCosta RicaCroatiaCubaCzechoslovakiaDenmarkDominicaDominican RepublicEastern AfricaEastern AsiaEastern EuropeEcuadorEgyptEl SalvadorEnglandEritreaEthiopiaEuropeFijiFranceGermanyGhanaGreeceGrenadaGuatemalaGuyanaHaitiHondurasHong KongHungaryIndiaIndonesiaIranIraqIrelandIsraelItalyJamaicaJapanJordanKazakhstanKenyaKoreaKuwaitLaosLatin AmericaLatviaLebanonLiberiaLithuaniaMalaysiaMexicoMicronesiaMiddle AfricaMoldovaMoroccoNepalNetherlandsNicaraguaNigeriaNorth AmericaNorth MacedoniaNorthern AfricaNorthern EuropeNorwayOceaniaPakistanPanamaPeruPhilippinesPolandPortugalRomaniaRussiaSaudi ArabiaScotlandSenegalSerbiaSierra LeoneSingaporeSomaliaSouth AfricaSouth AmericaSouth Central AsiaSouth Eastern AsiaSouthern EuropeSpainSri LankaSt. Vincent and the GrenadinesSudanSwedenSwitzerlandSyriaTaiwanThailandTrinidad and TobagoTurkeyUgandaUkraineUruguayUzbekistanVenezuelaVietnamWest IndiesWestern AfricaWestern AsiaWestern EuropeYemenZaireZimbabweAzores
Unemployment Among Ages 65 to 74 years
Income
Poverty
Unemployment
Labor Participation
Family Structure
Vehicle Availability
Education Level
Disability

Unemployment Among Ages 65 to 74 years Comparison

Celtics

Tongans

Excellent
Exceptional
5.3%
UNEMPLOYMENT AMONG AGES 65 TO 74 YEARS
80.8/ 100
METRIC RATING
136th/ 347
METRIC RANK
4.7%
UNEMPLOYMENT AMONG AGES 65 TO 74 YEARS
100.0/ 100
METRIC RATING
12th/ 347
METRIC RANK

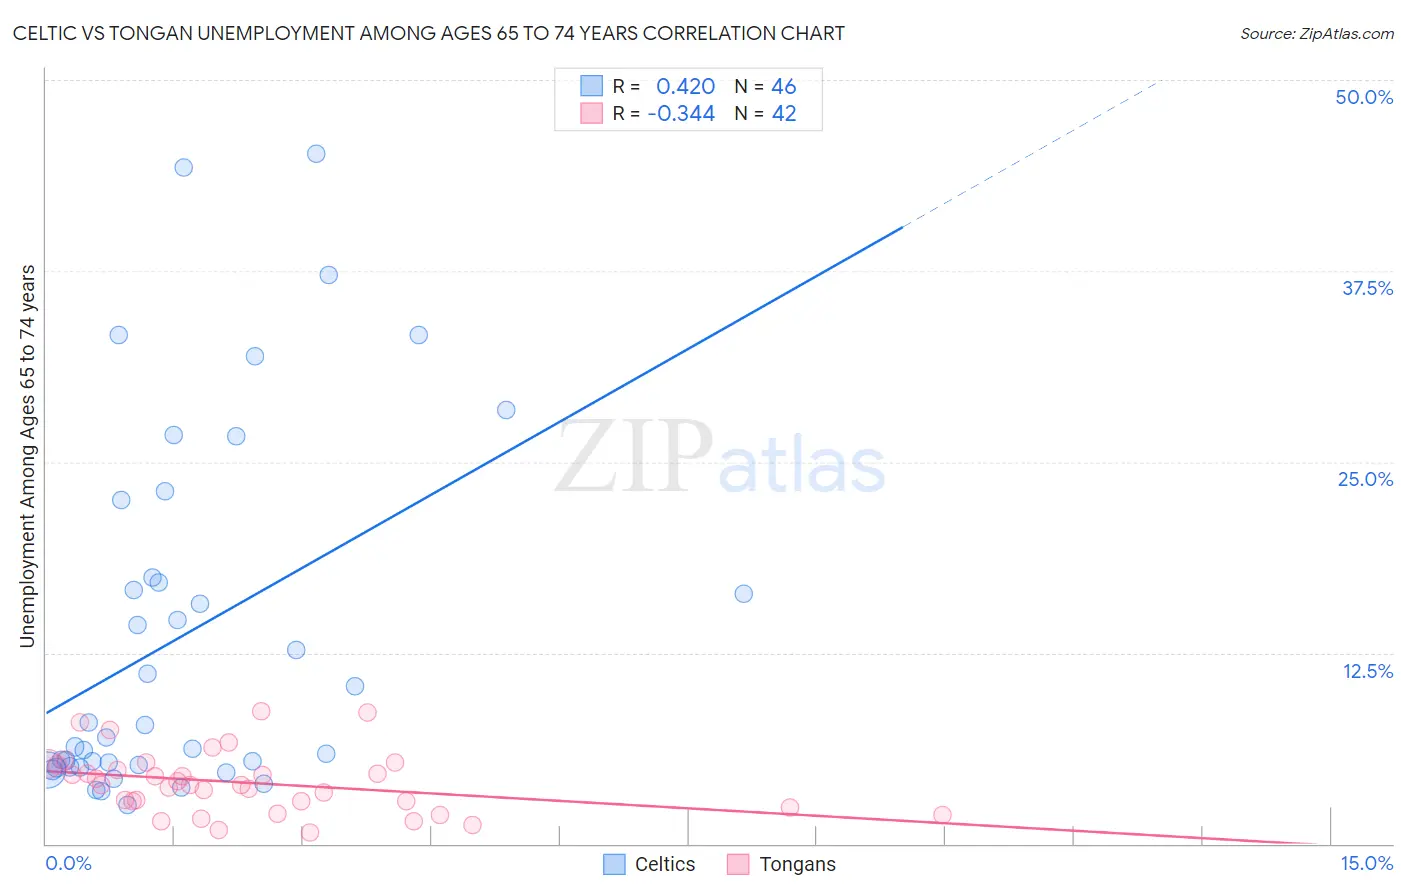
Celtic vs Tongan Unemployment Among Ages 65 to 74 years Correlation Chart

The statistical analysis conducted on geographies consisting of 155,250,318 people shows a moderate positive correlation between the proportion of Celtics and unemployment rate among population between the ages 65 and 74 in the United States with a correlation coefficient (R) of 0.420 and weighted average of 5.3%. Similarly, the statistical analysis conducted on geographies consisting of 96,791,109 people shows a mild negative correlation between the proportion of Tongans and unemployment rate among population between the ages 65 and 74 in the United States with a correlation coefficient (R) of -0.344 and weighted average of 4.7%, a difference of 11.7%.
Celtic vs Tongan Unemployment Among Ages 65 to 74 years

Unemployment Among Ages 65 to 74 years Correlation Summary

MeasurementCelticTongan
Minimum2.5%0.70%
Maximum45.2%8.7%
Range42.7%8.0%
Mean13.7%4.0%
Median7.4%3.9%
Interquartile 25% (IQ1)5.0%2.8%
Interquartile 75% (IQ3)17.4%5.2%
Interquartile Range (IQR)12.4%2.4%
Standard Deviation (Sample)11.7%2.0%
Standard Deviation (Population)11.6%2.0%

Similar Demographics by Unemployment Among Ages 65 to 74 years

Demographics Similar to Celtics by Unemployment Among Ages 65 to 74 years

In terms of unemployment among ages 65 to 74 years, the demographic groups most similar to Celtics are Immigrants from Afghanistan (5.3%, a difference of 0.0%), Immigrants from Serbia (5.3%, a difference of 0.050%), Immigrants from Panama (5.3%, a difference of 0.060%), Chilean (5.3%, a difference of 0.060%), and Ukrainian (5.3%, a difference of 0.070%).
DemographicsRating | RankUnemployment Among Ages 65 to 74 years
Immigrants | England
86.2
/100
|
#129
Excellent
5.3%
Eastern Europeans
85.6
/100
|
#130
Excellent
5.3%
Immigrants | Russia
83.0
/100
|
#131
Excellent
5.3%
Koreans
82.6
/100
|
#132
Excellent
5.3%
Ukrainians
82.0
/100
|
#133
Excellent
5.3%
Immigrants | Panama
81.8
/100
|
#134
Excellent
5.3%
Immigrants | Serbia
81.8
/100
|
#135
Excellent
5.3%
Celtics
80.8
/100
|
#136
Excellent
5.3%
Immigrants | Afghanistan
80.8
/100
|
#137
Excellent
5.3%
Chileans
79.7
/100
|
#138
Good
5.3%
Finns
79.0
/100
|
#139
Good
5.3%
Immigrants | Laos
78.6
/100
|
#140
Good
5.3%
Immigrants | Asia
78.4
/100
|
#141
Good
5.3%
Turks
76.2
/100
|
#142
Good
5.3%
New Zealanders
76.1
/100
|
#143
Good
5.3%

Demographics Similar to Tongans by Unemployment Among Ages 65 to 74 years

In terms of unemployment among ages 65 to 74 years, the demographic groups most similar to Tongans are Immigrants from Congo (4.7%, a difference of 0.16%), Lumbee (4.8%, a difference of 0.18%), Cuban (4.8%, a difference of 0.47%), Osage (4.7%, a difference of 0.57%), and Chickasaw (4.7%, a difference of 0.68%).
DemographicsRating | RankUnemployment Among Ages 65 to 74 years
Sudanese
100.0
/100
|
#5
Exceptional
4.6%
Immigrants | Cuba
100.0
/100
|
#6
Exceptional
4.6%
Indonesians
100.0
/100
|
#7
Exceptional
4.7%
Comanche
100.0
/100
|
#8
Exceptional
4.7%
Chickasaw
100.0
/100
|
#9
Exceptional
4.7%
Osage
100.0
/100
|
#10
Exceptional
4.7%
Immigrants | Congo
100.0
/100
|
#11
Exceptional
4.7%
Tongans
100.0
/100
|
#12
Exceptional
4.7%
Lumbee
100.0
/100
|
#13
Exceptional
4.8%
Cubans
100.0
/100
|
#14
Exceptional
4.8%
Immigrants | North Macedonia
100.0
/100
|
#15
Exceptional
4.8%
Immigrants | Burma/Myanmar
100.0
/100
|
#16
Exceptional
4.8%
Kenyans
100.0
/100
|
#17
Exceptional
4.8%
Creek
100.0
/100
|
#18
Exceptional
4.8%
Menominee
100.0
/100
|
#19
Exceptional
4.8%