Celtic vs Immigrants from Kazakhstan Master's Degree
COMPARE
Celtic
Immigrants from Kazakhstan
Master's Degree
Master's Degree Comparison
Celtics
Immigrants from Kazakhstan
14.8%
MASTER'S DEGREE
41.3/ 100
METRIC RATING
180th/ 347
METRIC RANK
18.0%
MASTER'S DEGREE
99.8/ 100
METRIC RATING
65th/ 347
METRIC RANK
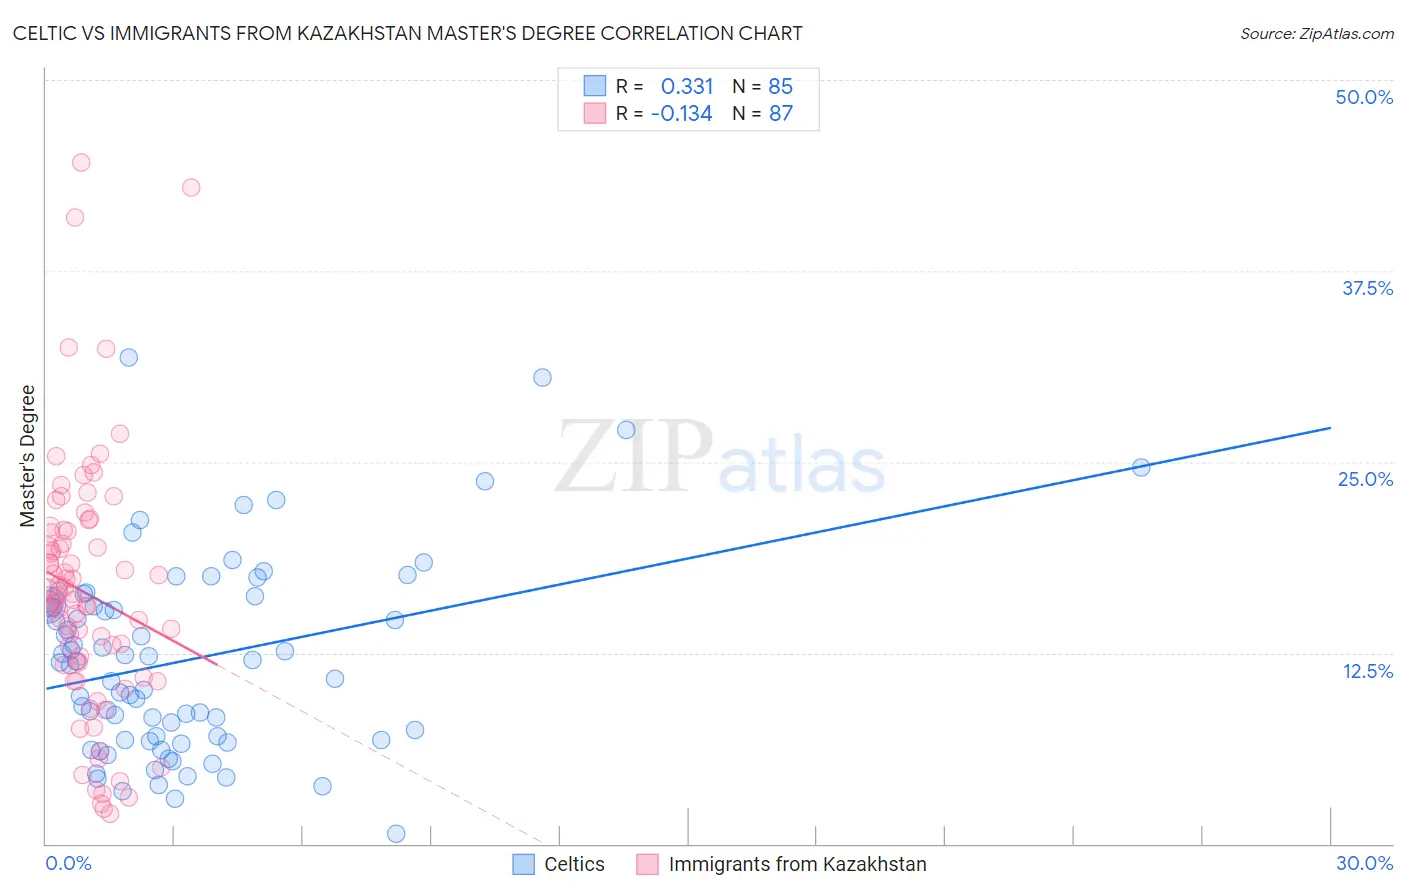
Celtic vs Immigrants from Kazakhstan Master's Degree Correlation Chart
The statistical analysis conducted on geographies consisting of 168,868,569 people shows a mild positive correlation between the proportion of Celtics and percentage of population with at least master's degree education in the United States with a correlation coefficient (R) of 0.331 and weighted average of 14.8%. Similarly, the statistical analysis conducted on geographies consisting of 124,419,458 people shows a poor negative correlation between the proportion of Immigrants from Kazakhstan and percentage of population with at least master's degree education in the United States with a correlation coefficient (R) of -0.134 and weighted average of 18.0%, a difference of 21.8%.
Master's Degree Correlation Summary
| Measurement | Celtic | Immigrants from Kazakhstan |
| Minimum | 0.67% | 1.9% |
| Maximum | 31.9% | 44.6% |
| Range | 31.2% | 42.7% |
| Mean | 12.0% | 16.4% |
| Median | 11.9% | 16.2% |
| Interquartile 25% (IQ1) | 6.8% | 11.7% |
| Interquartile 75% (IQ3) | 15.7% | 20.5% |
| Interquartile Range (IQR) | 9.0% | 8.7% |
| Standard Deviation (Sample) | 6.4% | 8.3% |
| Standard Deviation (Population) | 6.3% | 8.2% |
Similar Demographics by Master's Degree
Demographics Similar to Celtics by Master's Degree
In terms of master's degree, the demographic groups most similar to Celtics are Immigrants from Iraq (14.8%, a difference of 0.010%), Swiss (14.7%, a difference of 0.020%), Czech (14.7%, a difference of 0.12%), Sri Lankan (14.7%, a difference of 0.22%), and Immigrants from Zaire (14.7%, a difference of 0.25%).
| Demographics | Rating | Rank | Master's Degree |
| Costa Ricans | 52.5 /100 | #173 | Average 15.0% |
| Slovaks | 50.0 /100 | #174 | Average 14.9% |
| Immigrants | Peru | 49.6 /100 | #175 | Average 14.9% |
| Nigerians | 48.6 /100 | #176 | Average 14.9% |
| Immigrants | Colombia | 48.3 /100 | #177 | Average 14.9% |
| English | 45.0 /100 | #178 | Average 14.8% |
| Immigrants | Iraq | 41.3 /100 | #179 | Average 14.8% |
| Celtics | 41.3 /100 | #180 | Average 14.8% |
| Swiss | 41.1 /100 | #181 | Average 14.7% |
| Czechs | 40.4 /100 | #182 | Average 14.7% |
| Sri Lankans | 39.6 /100 | #183 | Fair 14.7% |
| Immigrants | Zaire | 39.5 /100 | #184 | Fair 14.7% |
| Barbadians | 38.3 /100 | #185 | Fair 14.7% |
| Immigrants | Oceania | 37.1 /100 | #186 | Fair 14.7% |
| Basques | 36.5 /100 | #187 | Fair 14.7% |
Demographics Similar to Immigrants from Kazakhstan by Master's Degree
In terms of master's degree, the demographic groups most similar to Immigrants from Kazakhstan are Ethiopian (18.0%, a difference of 0.020%), Immigrants from Argentina (18.0%, a difference of 0.070%), Immigrants from Ethiopia (17.9%, a difference of 0.30%), Immigrants from Uzbekistan (17.9%, a difference of 0.62%), and South African (18.1%, a difference of 0.70%).
| Demographics | Rating | Rank | Master's Degree |
| Australians | 99.9 /100 | #58 | Exceptional 18.4% |
| Immigrants | Bulgaria | 99.9 /100 | #59 | Exceptional 18.3% |
| New Zealanders | 99.9 /100 | #60 | Exceptional 18.3% |
| Immigrants | Europe | 99.9 /100 | #61 | Exceptional 18.2% |
| Argentineans | 99.9 /100 | #62 | Exceptional 18.2% |
| Immigrants | Netherlands | 99.9 /100 | #63 | Exceptional 18.1% |
| South Africans | 99.9 /100 | #64 | Exceptional 18.1% |
| Immigrants | Kazakhstan | 99.8 /100 | #65 | Exceptional 18.0% |
| Ethiopians | 99.8 /100 | #66 | Exceptional 18.0% |
| Immigrants | Argentina | 99.8 /100 | #67 | Exceptional 18.0% |
| Immigrants | Ethiopia | 99.8 /100 | #68 | Exceptional 17.9% |
| Immigrants | Uzbekistan | 99.8 /100 | #69 | Exceptional 17.9% |
| Immigrants | Western Europe | 99.8 /100 | #70 | Exceptional 17.8% |
| Immigrants | Pakistan | 99.7 /100 | #71 | Exceptional 17.8% |
| Lithuanians | 99.7 /100 | #72 | Exceptional 17.7% |