Marshallese vs Immigrants from Kazakhstan Unemployment
COMPARE
Marshallese
Immigrants from Kazakhstan
Unemployment
Unemployment Comparison
Marshallese
Immigrants from Kazakhstan
5.6%
UNEMPLOYMENT
1.3/ 100
METRIC RATING
243rd/ 347
METRIC RANK
5.2%
UNEMPLOYMENT
70.4/ 100
METRIC RATING
156th/ 347
METRIC RANK
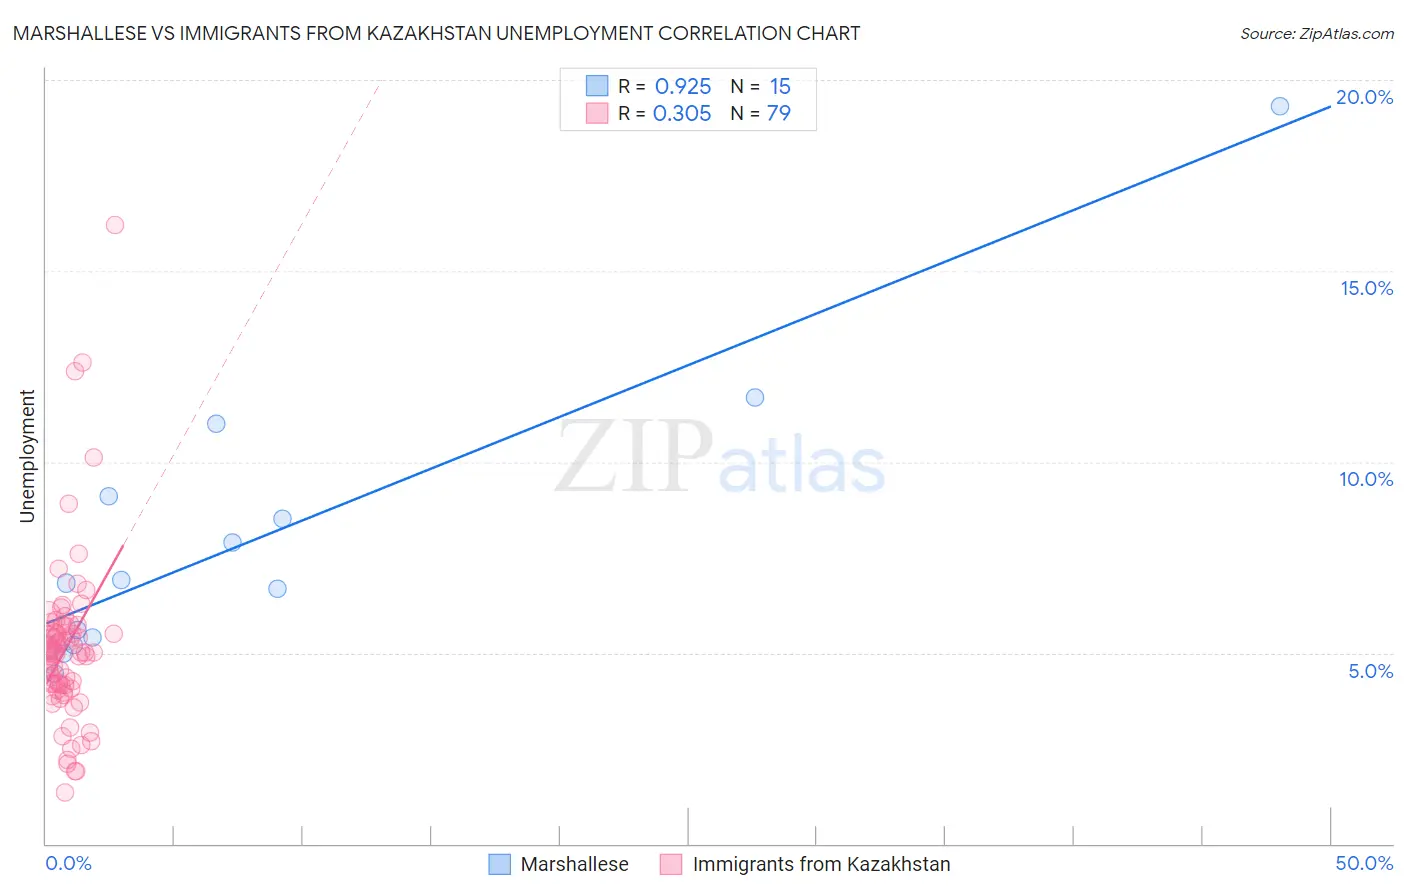
Marshallese vs Immigrants from Kazakhstan Unemployment Correlation Chart
The statistical analysis conducted on geographies consisting of 14,759,035 people shows a near-perfect positive correlation between the proportion of Marshallese and unemployment in the United States with a correlation coefficient (R) of 0.925 and weighted average of 5.6%. Similarly, the statistical analysis conducted on geographies consisting of 124,418,650 people shows a mild positive correlation between the proportion of Immigrants from Kazakhstan and unemployment in the United States with a correlation coefficient (R) of 0.305 and weighted average of 5.2%, a difference of 8.1%.
Unemployment Correlation Summary
| Measurement | Marshallese | Immigrants from Kazakhstan |
| Minimum | 4.5% | 1.3% |
| Maximum | 19.3% | 16.2% |
| Range | 14.8% | 14.9% |
| Mean | 7.9% | 5.1% |
| Median | 6.8% | 5.0% |
| Interquartile 25% (IQ1) | 5.2% | 4.0% |
| Interquartile 75% (IQ3) | 9.1% | 5.7% |
| Interquartile Range (IQR) | 3.9% | 1.6% |
| Standard Deviation (Sample) | 3.8% | 2.3% |
| Standard Deviation (Population) | 3.7% | 2.3% |
Similar Demographics by Unemployment
Demographics Similar to Marshallese by Unemployment
In terms of unemployment, the demographic groups most similar to Marshallese are Dutch West Indian (5.6%, a difference of 0.15%), French American Indian (5.6%, a difference of 0.17%), Bermudan (5.6%, a difference of 0.22%), Immigrants from Cameroon (5.6%, a difference of 0.36%), and Liberian (5.6%, a difference of 0.49%).
| Demographics | Rating | Rank | Unemployment |
| Immigrants | Cambodia | 3.3 /100 | #236 | Tragic 5.5% |
| Moroccans | 3.2 /100 | #237 | Tragic 5.5% |
| Immigrants | Western Asia | 2.8 /100 | #238 | Tragic 5.5% |
| Immigrants | Immigrants | 2.6 /100 | #239 | Tragic 5.5% |
| Cree | 2.6 /100 | #240 | Tragic 5.6% |
| Tlingit-Haida | 2.0 /100 | #241 | Tragic 5.6% |
| Spanish Americans | 2.0 /100 | #242 | Tragic 5.6% |
| Marshallese | 1.3 /100 | #243 | Tragic 5.6% |
| Dutch West Indians | 1.2 /100 | #244 | Tragic 5.6% |
| French American Indians | 1.2 /100 | #245 | Tragic 5.6% |
| Bermudans | 1.1 /100 | #246 | Tragic 5.6% |
| Immigrants | Cameroon | 1.0 /100 | #247 | Tragic 5.6% |
| Liberians | 0.9 /100 | #248 | Tragic 5.6% |
| Cajuns | 0.8 /100 | #249 | Tragic 5.6% |
| Japanese | 0.8 /100 | #250 | Tragic 5.6% |
Demographics Similar to Immigrants from Kazakhstan by Unemployment
In terms of unemployment, the demographic groups most similar to Immigrants from Kazakhstan are Sri Lankan (5.2%, a difference of 0.060%), Immigrants from Northern Africa (5.2%, a difference of 0.070%), Immigrants from Egypt (5.2%, a difference of 0.27%), Immigrants from Russia (5.2%, a difference of 0.27%), and Laotian (5.2%, a difference of 0.29%).
| Demographics | Rating | Rank | Unemployment |
| Syrians | 77.7 /100 | #149 | Good 5.2% |
| Potawatomi | 76.2 /100 | #150 | Good 5.2% |
| Immigrants | Eastern Europe | 75.3 /100 | #151 | Good 5.2% |
| Immigrants | Hong Kong | 75.2 /100 | #152 | Good 5.2% |
| Egyptians | 75.2 /100 | #153 | Good 5.2% |
| Immigrants | China | 74.7 /100 | #154 | Good 5.2% |
| Immigrants | Northern Africa | 71.3 /100 | #155 | Good 5.2% |
| Immigrants | Kazakhstan | 70.4 /100 | #156 | Good 5.2% |
| Sri Lankans | 69.5 /100 | #157 | Good 5.2% |
| Immigrants | Egypt | 66.7 /100 | #158 | Good 5.2% |
| Immigrants | Russia | 66.6 /100 | #159 | Good 5.2% |
| Laotians | 66.3 /100 | #160 | Good 5.2% |
| Immigrants | Oceania | 65.2 /100 | #161 | Good 5.2% |
| Spanish | 65.1 /100 | #162 | Good 5.2% |
| Immigrants | Zaire | 64.7 /100 | #163 | Good 5.2% |