Bulgarian vs Czechoslovakian Median Female Earnings
COMPARE
Bulgarian
Czechoslovakian
Median Female Earnings
Median Female Earnings Comparison
Bulgarians
Czechoslovakians
$43,638
MEDIAN FEMALE EARNINGS
100.0/ 100
METRIC RATING
43rd/ 347
METRIC RANK
$38,738
MEDIAN FEMALE EARNINGS
12.0/ 100
METRIC RATING
210th/ 347
METRIC RANK
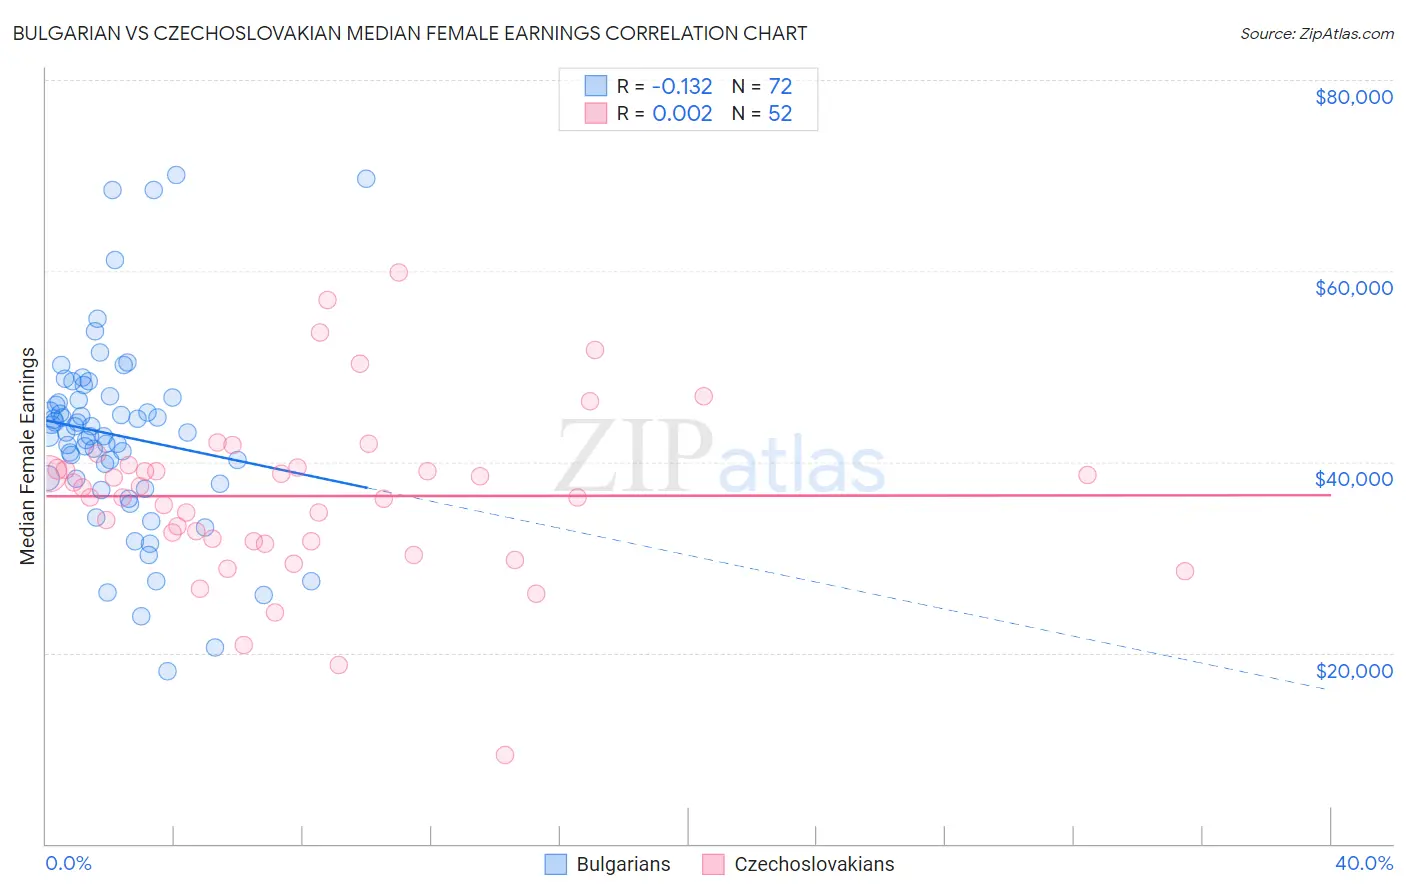
Bulgarian vs Czechoslovakian Median Female Earnings Correlation Chart
The statistical analysis conducted on geographies consisting of 205,601,132 people shows a poor negative correlation between the proportion of Bulgarians and median female earnings in the United States with a correlation coefficient (R) of -0.132 and weighted average of $43,638. Similarly, the statistical analysis conducted on geographies consisting of 368,499,928 people shows no correlation between the proportion of Czechoslovakians and median female earnings in the United States with a correlation coefficient (R) of 0.002 and weighted average of $38,738, a difference of 12.7%.
Median Female Earnings Correlation Summary
| Measurement | Bulgarian | Czechoslovakian |
| Minimum | $18,066 | $9,297 |
| Maximum | $70,060 | $59,868 |
| Range | $51,994 | $50,571 |
| Mean | $42,770 | $36,417 |
| Median | $43,122 | $36,782 |
| Interquartile 25% (IQ1) | $37,998 | $31,695 |
| Interquartile 75% (IQ3) | $46,606 | $39,301 |
| Interquartile Range (IQR) | $8,608 | $7,606 |
| Standard Deviation (Sample) | $10,148 | $8,994 |
| Standard Deviation (Population) | $10,078 | $8,907 |
Similar Demographics by Median Female Earnings
Demographics Similar to Bulgarians by Median Female Earnings
In terms of median female earnings, the demographic groups most similar to Bulgarians are Bhutanese ($43,648, a difference of 0.020%), Immigrants from Denmark ($43,646, a difference of 0.020%), Immigrants from Czechoslovakia ($43,571, a difference of 0.15%), Immigrants from Europe ($43,523, a difference of 0.26%), and Immigrants from Bolivia ($43,467, a difference of 0.39%).
| Demographics | Rating | Rank | Median Female Earnings |
| Immigrants | Turkey | 100.0 /100 | #36 | Exceptional $44,066 |
| Immigrants | Switzerland | 100.0 /100 | #37 | Exceptional $43,996 |
| Latvians | 100.0 /100 | #38 | Exceptional $43,941 |
| Israelis | 100.0 /100 | #39 | Exceptional $43,852 |
| Immigrants | Malaysia | 100.0 /100 | #40 | Exceptional $43,835 |
| Bhutanese | 100.0 /100 | #41 | Exceptional $43,648 |
| Immigrants | Denmark | 100.0 /100 | #42 | Exceptional $43,646 |
| Bulgarians | 100.0 /100 | #43 | Exceptional $43,638 |
| Immigrants | Czechoslovakia | 100.0 /100 | #44 | Exceptional $43,571 |
| Immigrants | Europe | 100.0 /100 | #45 | Exceptional $43,523 |
| Immigrants | Bolivia | 100.0 /100 | #46 | Exceptional $43,467 |
| Bolivians | 100.0 /100 | #47 | Exceptional $43,445 |
| Immigrants | Indonesia | 100.0 /100 | #48 | Exceptional $43,412 |
| Immigrants | Serbia | 100.0 /100 | #49 | Exceptional $43,385 |
| Immigrants | Uzbekistan | 100.0 /100 | #50 | Exceptional $43,363 |
Demographics Similar to Czechoslovakians by Median Female Earnings
In terms of median female earnings, the demographic groups most similar to Czechoslovakians are Aleut ($38,719, a difference of 0.050%), Guamanian/Chamorro ($38,717, a difference of 0.050%), Norwegian ($38,802, a difference of 0.17%), Jamaican ($38,670, a difference of 0.18%), and Immigrants from Thailand ($38,810, a difference of 0.19%).
| Demographics | Rating | Rank | Median Female Earnings |
| Czechs | 18.7 /100 | #203 | Poor $38,992 |
| Immigrants | Uruguay | 17.3 /100 | #204 | Poor $38,945 |
| Immigrants | Colombia | 16.3 /100 | #205 | Poor $38,913 |
| Immigrants | Bosnia and Herzegovina | 15.6 /100 | #206 | Poor $38,886 |
| Immigrants | Cambodia | 14.2 /100 | #207 | Poor $38,833 |
| Immigrants | Thailand | 13.6 /100 | #208 | Poor $38,810 |
| Norwegians | 13.4 /100 | #209 | Poor $38,802 |
| Czechoslovakians | 12.0 /100 | #210 | Poor $38,738 |
| Aleuts | 11.6 /100 | #211 | Poor $38,719 |
| Guamanians/Chamorros | 11.5 /100 | #212 | Poor $38,717 |
| Jamaicans | 10.5 /100 | #213 | Poor $38,670 |
| Iraqis | 10.5 /100 | #214 | Poor $38,666 |
| Spaniards | 10.3 /100 | #215 | Poor $38,656 |
| Immigrants | Ecuador | 10.1 /100 | #216 | Poor $38,644 |
| Immigrants | Jamaica | 9.7 /100 | #217 | Tragic $38,625 |