Bulgarian vs American Unemployment
COMPARE
Bulgarian
American
Unemployment
Unemployment Comparison
Bulgarians
Americans
4.7%
UNEMPLOYMENT
99.9/ 100
METRIC RATING
26th/ 347
METRIC RANK
5.0%
UNEMPLOYMENT
94.3/ 100
METRIC RATING
101st/ 347
METRIC RANK
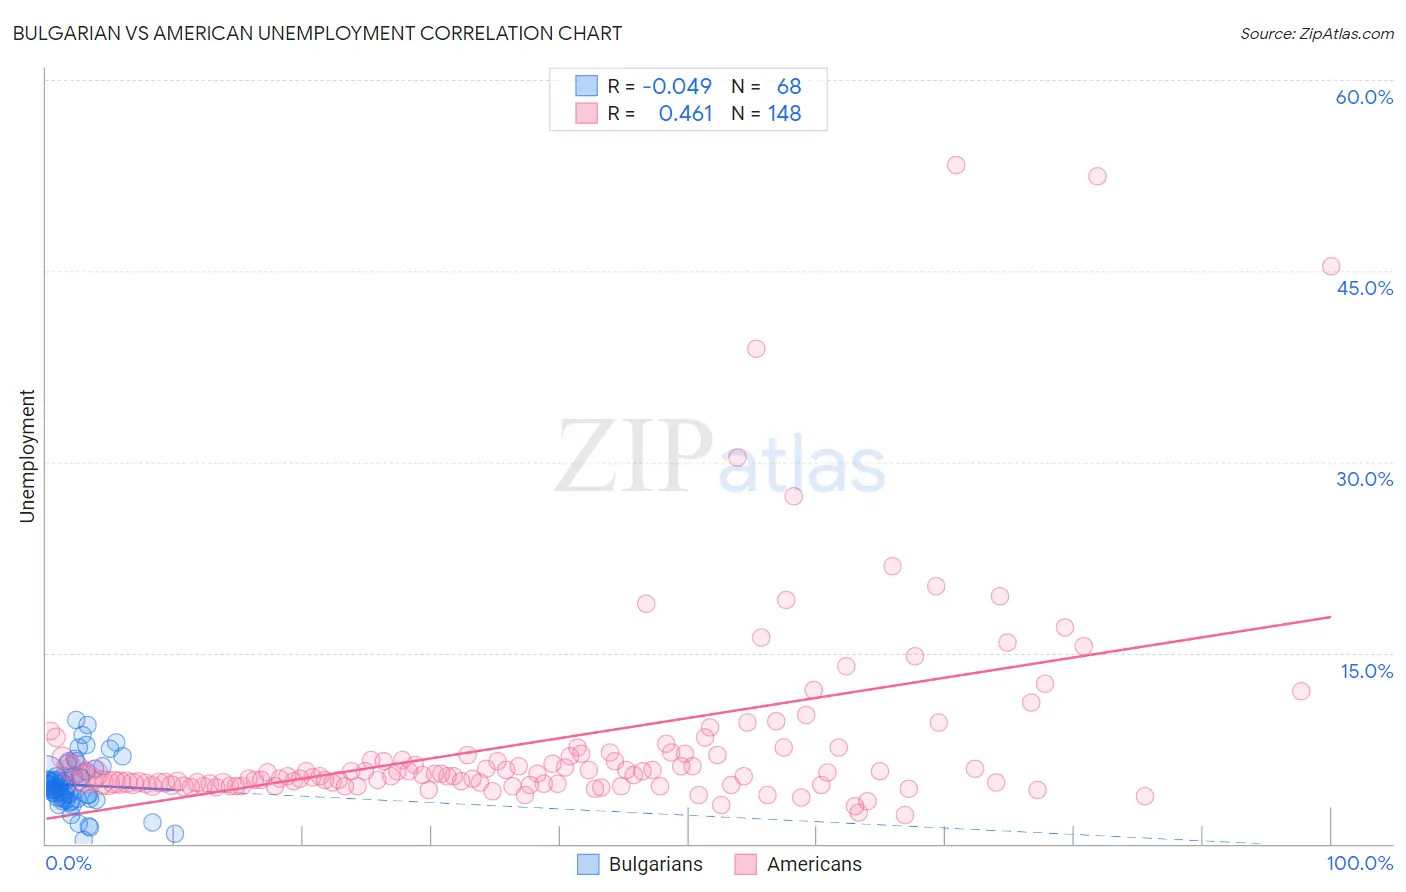
Bulgarian vs American Unemployment Correlation Chart
The statistical analysis conducted on geographies consisting of 205,555,783 people shows no correlation between the proportion of Bulgarians and unemployment in the United States with a correlation coefficient (R) of -0.049 and weighted average of 4.7%. Similarly, the statistical analysis conducted on geographies consisting of 576,683,680 people shows a moderate positive correlation between the proportion of Americans and unemployment in the United States with a correlation coefficient (R) of 0.461 and weighted average of 5.0%, a difference of 6.7%.
Unemployment Correlation Summary
| Measurement | Bulgarian | American |
| Minimum | 0.30% | 2.2% |
| Maximum | 9.7% | 53.3% |
| Range | 9.4% | 51.1% |
| Mean | 4.6% | 8.0% |
| Median | 4.5% | 5.4% |
| Interquartile 25% (IQ1) | 3.6% | 4.7% |
| Interquartile 75% (IQ3) | 5.3% | 7.0% |
| Interquartile Range (IQR) | 1.7% | 2.3% |
| Standard Deviation (Sample) | 1.9% | 8.0% |
| Standard Deviation (Population) | 1.8% | 8.0% |
Similar Demographics by Unemployment
Demographics Similar to Bulgarians by Unemployment
In terms of unemployment, the demographic groups most similar to Bulgarians are Latvian (4.7%, a difference of 0.040%), Venezuelan (4.7%, a difference of 0.11%), British (4.7%, a difference of 0.19%), Finnish (4.7%, a difference of 0.21%), and Welsh (4.7%, a difference of 0.49%).
| Demographics | Rating | Rank | Unemployment |
| Scottish | 99.9 /100 | #19 | Exceptional 4.7% |
| Carpatho Rusyns | 99.9 /100 | #20 | Exceptional 4.7% |
| Welsh | 99.9 /100 | #21 | Exceptional 4.7% |
| Thais | 99.9 /100 | #22 | Exceptional 4.7% |
| British | 99.9 /100 | #23 | Exceptional 4.7% |
| Venezuelans | 99.9 /100 | #24 | Exceptional 4.7% |
| Latvians | 99.9 /100 | #25 | Exceptional 4.7% |
| Bulgarians | 99.9 /100 | #26 | Exceptional 4.7% |
| Finns | 99.9 /100 | #27 | Exceptional 4.7% |
| Cubans | 99.8 /100 | #28 | Exceptional 4.7% |
| Poles | 99.8 /100 | #29 | Exceptional 4.7% |
| Irish | 99.8 /100 | #30 | Exceptional 4.8% |
| Croatians | 99.8 /100 | #31 | Exceptional 4.8% |
| Zimbabweans | 99.8 /100 | #32 | Exceptional 4.8% |
| Sudanese | 99.8 /100 | #33 | Exceptional 4.8% |
Demographics Similar to Americans by Unemployment
In terms of unemployment, the demographic groups most similar to Americans are Immigrants from Argentina (5.0%, a difference of 0.050%), Chickasaw (5.0%, a difference of 0.080%), Osage (5.0%, a difference of 0.080%), Maltese (5.0%, a difference of 0.090%), and Estonian (5.0%, a difference of 0.10%).
| Demographics | Rating | Rank | Unemployment |
| Immigrants | Austria | 95.9 /100 | #94 | Exceptional 5.0% |
| Immigrants | Serbia | 95.6 /100 | #95 | Exceptional 5.0% |
| Immigrants | England | 95.2 /100 | #96 | Exceptional 5.0% |
| Immigrants | Czechoslovakia | 95.1 /100 | #97 | Exceptional 5.0% |
| Romanians | 95.0 /100 | #98 | Exceptional 5.0% |
| Mongolians | 94.8 /100 | #99 | Exceptional 5.0% |
| Estonians | 94.6 /100 | #100 | Exceptional 5.0% |
| Americans | 94.3 /100 | #101 | Exceptional 5.0% |
| Immigrants | Argentina | 94.1 /100 | #102 | Exceptional 5.0% |
| Chickasaw | 94.0 /100 | #103 | Exceptional 5.0% |
| Osage | 94.0 /100 | #104 | Exceptional 5.0% |
| Maltese | 94.0 /100 | #105 | Exceptional 5.0% |
| Immigrants | Romania | 93.7 /100 | #106 | Exceptional 5.0% |
| Immigrants | Turkey | 93.7 /100 | #107 | Exceptional 5.0% |
| Immigrants | Kuwait | 93.7 /100 | #108 | Exceptional 5.0% |