Bulgarian vs Immigrants from Haiti Unemployment
COMPARE
Bulgarian
Immigrants from Haiti
Unemployment
Unemployment Comparison
Bulgarians
Immigrants from Haiti
4.7%
UNEMPLOYMENT
99.9/ 100
METRIC RATING
26th/ 347
METRIC RANK
6.3%
UNEMPLOYMENT
0.0/ 100
METRIC RATING
298th/ 347
METRIC RANK
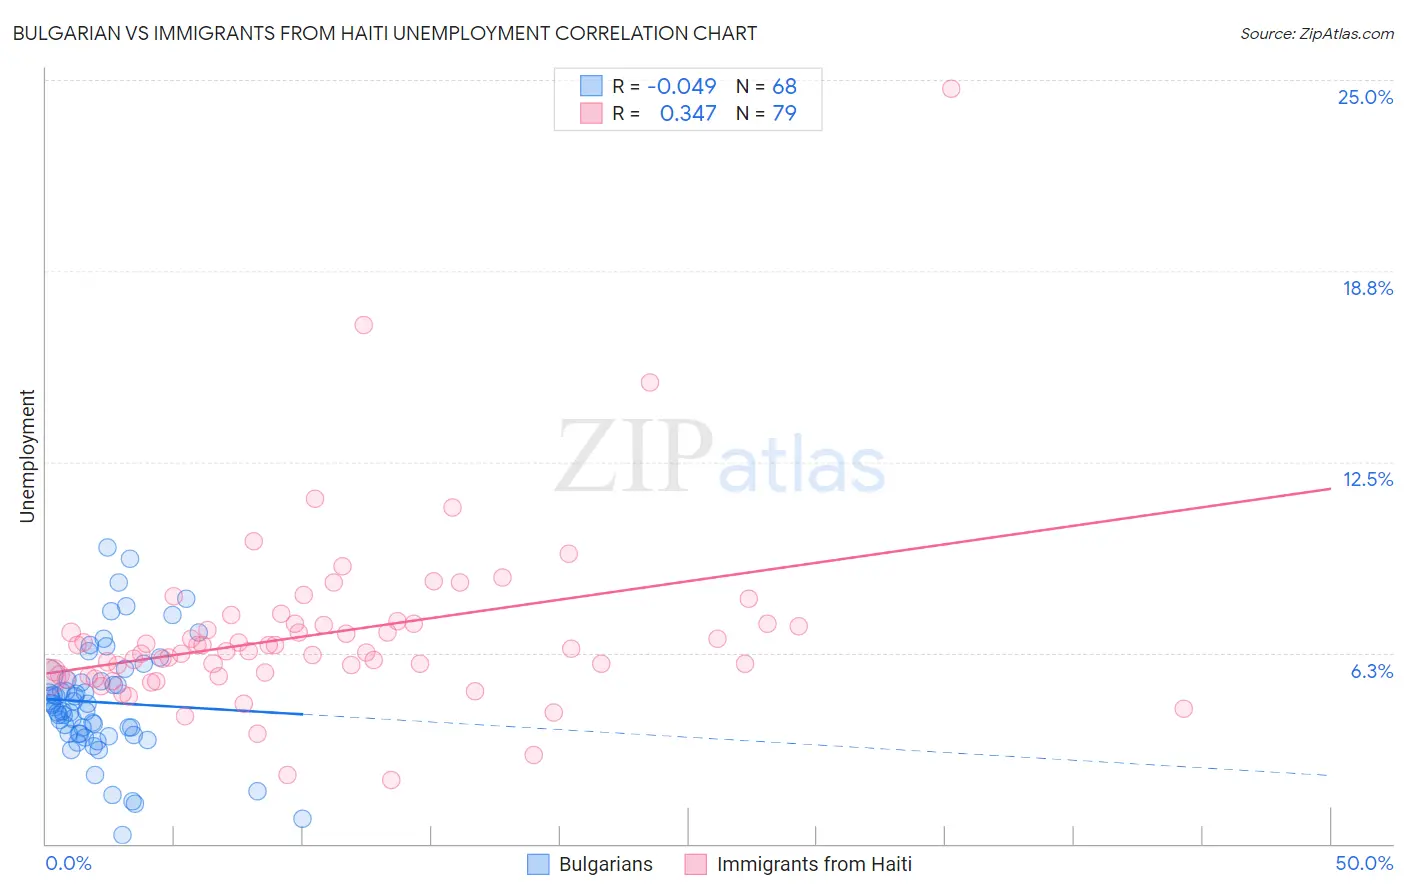
Bulgarian vs Immigrants from Haiti Unemployment Correlation Chart
The statistical analysis conducted on geographies consisting of 205,555,783 people shows no correlation between the proportion of Bulgarians and unemployment in the United States with a correlation coefficient (R) of -0.049 and weighted average of 4.7%. Similarly, the statistical analysis conducted on geographies consisting of 225,163,830 people shows a mild positive correlation between the proportion of Immigrants from Haiti and unemployment in the United States with a correlation coefficient (R) of 0.347 and weighted average of 6.3%, a difference of 33.8%.
Unemployment Correlation Summary
| Measurement | Bulgarian | Immigrants from Haiti |
| Minimum | 0.30% | 2.1% |
| Maximum | 9.7% | 24.7% |
| Range | 9.4% | 22.6% |
| Mean | 4.6% | 6.9% |
| Median | 4.5% | 6.3% |
| Interquartile 25% (IQ1) | 3.6% | 5.5% |
| Interquartile 75% (IQ3) | 5.3% | 7.2% |
| Interquartile Range (IQR) | 1.7% | 1.7% |
| Standard Deviation (Sample) | 1.9% | 3.0% |
| Standard Deviation (Population) | 1.8% | 3.0% |
Similar Demographics by Unemployment
Demographics Similar to Bulgarians by Unemployment
In terms of unemployment, the demographic groups most similar to Bulgarians are Latvian (4.7%, a difference of 0.040%), Venezuelan (4.7%, a difference of 0.11%), British (4.7%, a difference of 0.19%), Finnish (4.7%, a difference of 0.21%), and Welsh (4.7%, a difference of 0.49%).
| Demographics | Rating | Rank | Unemployment |
| Scottish | 99.9 /100 | #19 | Exceptional 4.7% |
| Carpatho Rusyns | 99.9 /100 | #20 | Exceptional 4.7% |
| Welsh | 99.9 /100 | #21 | Exceptional 4.7% |
| Thais | 99.9 /100 | #22 | Exceptional 4.7% |
| British | 99.9 /100 | #23 | Exceptional 4.7% |
| Venezuelans | 99.9 /100 | #24 | Exceptional 4.7% |
| Latvians | 99.9 /100 | #25 | Exceptional 4.7% |
| Bulgarians | 99.9 /100 | #26 | Exceptional 4.7% |
| Finns | 99.9 /100 | #27 | Exceptional 4.7% |
| Cubans | 99.8 /100 | #28 | Exceptional 4.7% |
| Poles | 99.8 /100 | #29 | Exceptional 4.7% |
| Irish | 99.8 /100 | #30 | Exceptional 4.8% |
| Croatians | 99.8 /100 | #31 | Exceptional 4.8% |
| Zimbabweans | 99.8 /100 | #32 | Exceptional 4.8% |
| Sudanese | 99.8 /100 | #33 | Exceptional 4.8% |
Demographics Similar to Immigrants from Haiti by Unemployment
In terms of unemployment, the demographic groups most similar to Immigrants from Haiti are Immigrants from West Indies (6.3%, a difference of 0.050%), Jamaican (6.3%, a difference of 0.090%), Immigrants from Trinidad and Tobago (6.3%, a difference of 0.17%), Ute (6.3%, a difference of 0.43%), and Trinidadian and Tobagonian (6.3%, a difference of 0.65%).
| Demographics | Rating | Rank | Unemployment |
| Haitians | 0.0 /100 | #291 | Tragic 6.2% |
| Central American Indians | 0.0 /100 | #292 | Tragic 6.2% |
| Immigrants | Ecuador | 0.0 /100 | #293 | Tragic 6.2% |
| Spanish American Indians | 0.0 /100 | #294 | Tragic 6.2% |
| U.S. Virgin Islanders | 0.0 /100 | #295 | Tragic 6.3% |
| Ute | 0.0 /100 | #296 | Tragic 6.3% |
| Jamaicans | 0.0 /100 | #297 | Tragic 6.3% |
| Immigrants | Haiti | 0.0 /100 | #298 | Tragic 6.3% |
| Immigrants | West Indies | 0.0 /100 | #299 | Tragic 6.3% |
| Immigrants | Trinidad and Tobago | 0.0 /100 | #300 | Tragic 6.3% |
| Trinidadians and Tobagonians | 0.0 /100 | #301 | Tragic 6.3% |
| West Indians | 0.0 /100 | #302 | Tragic 6.4% |
| Belizeans | 0.0 /100 | #303 | Tragic 6.4% |
| Immigrants | Jamaica | 0.0 /100 | #304 | Tragic 6.4% |
| Menominee | 0.0 /100 | #305 | Tragic 6.4% |