Bulgarian vs Immigrants from Iraq Unemployment
COMPARE
Bulgarian
Immigrants from Iraq
Unemployment
Unemployment Comparison
Bulgarians
Immigrants from Iraq
4.7%
UNEMPLOYMENT
99.9/ 100
METRIC RATING
26th/ 347
METRIC RANK
5.4%
UNEMPLOYMENT
18.6/ 100
METRIC RATING
210th/ 347
METRIC RANK
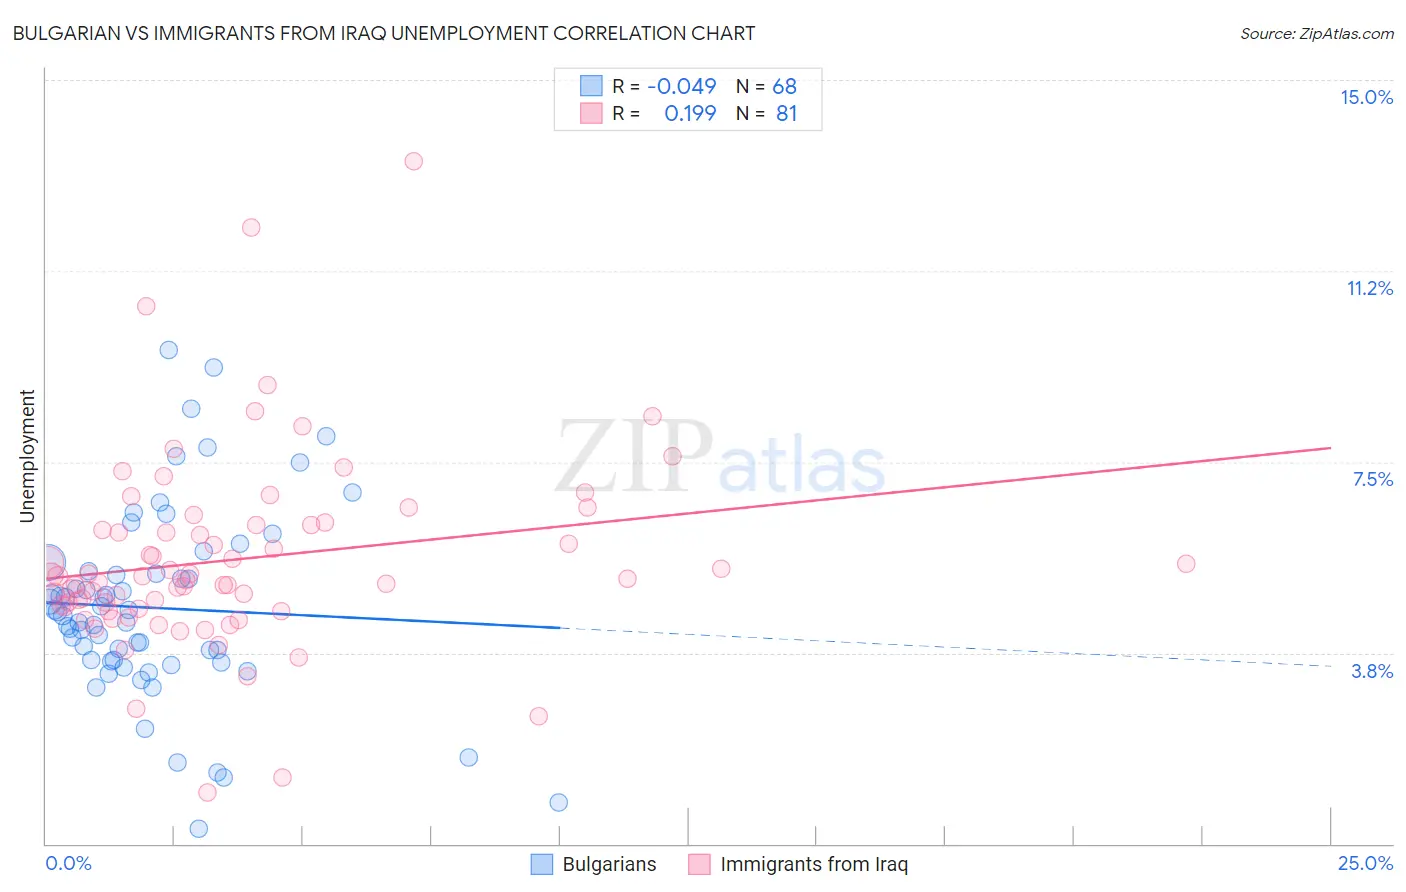
Bulgarian vs Immigrants from Iraq Unemployment Correlation Chart
The statistical analysis conducted on geographies consisting of 205,555,783 people shows no correlation between the proportion of Bulgarians and unemployment in the United States with a correlation coefficient (R) of -0.049 and weighted average of 4.7%. Similarly, the statistical analysis conducted on geographies consisting of 194,739,178 people shows a poor positive correlation between the proportion of Immigrants from Iraq and unemployment in the United States with a correlation coefficient (R) of 0.199 and weighted average of 5.4%, a difference of 14.1%.
Unemployment Correlation Summary
| Measurement | Bulgarian | Immigrants from Iraq |
| Minimum | 0.30% | 1.0% |
| Maximum | 9.7% | 13.4% |
| Range | 9.4% | 12.4% |
| Mean | 4.6% | 5.6% |
| Median | 4.5% | 5.2% |
| Interquartile 25% (IQ1) | 3.6% | 4.6% |
| Interquartile 75% (IQ3) | 5.3% | 6.3% |
| Interquartile Range (IQR) | 1.7% | 1.6% |
| Standard Deviation (Sample) | 1.9% | 1.9% |
| Standard Deviation (Population) | 1.8% | 1.9% |
Similar Demographics by Unemployment
Demographics Similar to Bulgarians by Unemployment
In terms of unemployment, the demographic groups most similar to Bulgarians are Latvian (4.7%, a difference of 0.040%), Venezuelan (4.7%, a difference of 0.11%), British (4.7%, a difference of 0.19%), Finnish (4.7%, a difference of 0.21%), and Welsh (4.7%, a difference of 0.49%).
| Demographics | Rating | Rank | Unemployment |
| Scottish | 99.9 /100 | #19 | Exceptional 4.7% |
| Carpatho Rusyns | 99.9 /100 | #20 | Exceptional 4.7% |
| Welsh | 99.9 /100 | #21 | Exceptional 4.7% |
| Thais | 99.9 /100 | #22 | Exceptional 4.7% |
| British | 99.9 /100 | #23 | Exceptional 4.7% |
| Venezuelans | 99.9 /100 | #24 | Exceptional 4.7% |
| Latvians | 99.9 /100 | #25 | Exceptional 4.7% |
| Bulgarians | 99.9 /100 | #26 | Exceptional 4.7% |
| Finns | 99.9 /100 | #27 | Exceptional 4.7% |
| Cubans | 99.8 /100 | #28 | Exceptional 4.7% |
| Poles | 99.8 /100 | #29 | Exceptional 4.7% |
| Irish | 99.8 /100 | #30 | Exceptional 4.8% |
| Croatians | 99.8 /100 | #31 | Exceptional 4.8% |
| Zimbabweans | 99.8 /100 | #32 | Exceptional 4.8% |
| Sudanese | 99.8 /100 | #33 | Exceptional 4.8% |
Demographics Similar to Immigrants from Iraq by Unemployment
In terms of unemployment, the demographic groups most similar to Immigrants from Iraq are Immigrants from Iran (5.4%, a difference of 0.020%), Portuguese (5.4%, a difference of 0.050%), Iraqi (5.4%, a difference of 0.050%), Ugandan (5.4%, a difference of 0.060%), and Creek (5.4%, a difference of 0.080%).
| Demographics | Rating | Rank | Unemployment |
| Immigrants | Micronesia | 25.2 /100 | #203 | Fair 5.3% |
| Immigrants | Ukraine | 24.9 /100 | #204 | Fair 5.3% |
| Native Hawaiians | 24.1 /100 | #205 | Fair 5.3% |
| Immigrants | Peru | 22.7 /100 | #206 | Fair 5.4% |
| Creek | 19.4 /100 | #207 | Poor 5.4% |
| Portuguese | 19.0 /100 | #208 | Poor 5.4% |
| Immigrants | Iran | 18.8 /100 | #209 | Poor 5.4% |
| Immigrants | Iraq | 18.6 /100 | #210 | Poor 5.4% |
| Iraqis | 18.1 /100 | #211 | Poor 5.4% |
| Ugandans | 18.0 /100 | #212 | Poor 5.4% |
| Immigrants | Middle Africa | 15.3 /100 | #213 | Poor 5.4% |
| Immigrants | Costa Rica | 15.2 /100 | #214 | Poor 5.4% |
| Delaware | 14.7 /100 | #215 | Poor 5.4% |
| Immigrants | South America | 13.5 /100 | #216 | Poor 5.4% |
| Immigrants | Albania | 13.5 /100 | #217 | Poor 5.4% |