Bulgarian vs Palestinian Unemployment
COMPARE
Bulgarian
Palestinian
Unemployment
Unemployment Comparison
Bulgarians
Palestinians
4.7%
UNEMPLOYMENT
99.9/ 100
METRIC RATING
26th/ 347
METRIC RANK
5.1%
UNEMPLOYMENT
83.4/ 100
METRIC RATING
141st/ 347
METRIC RANK
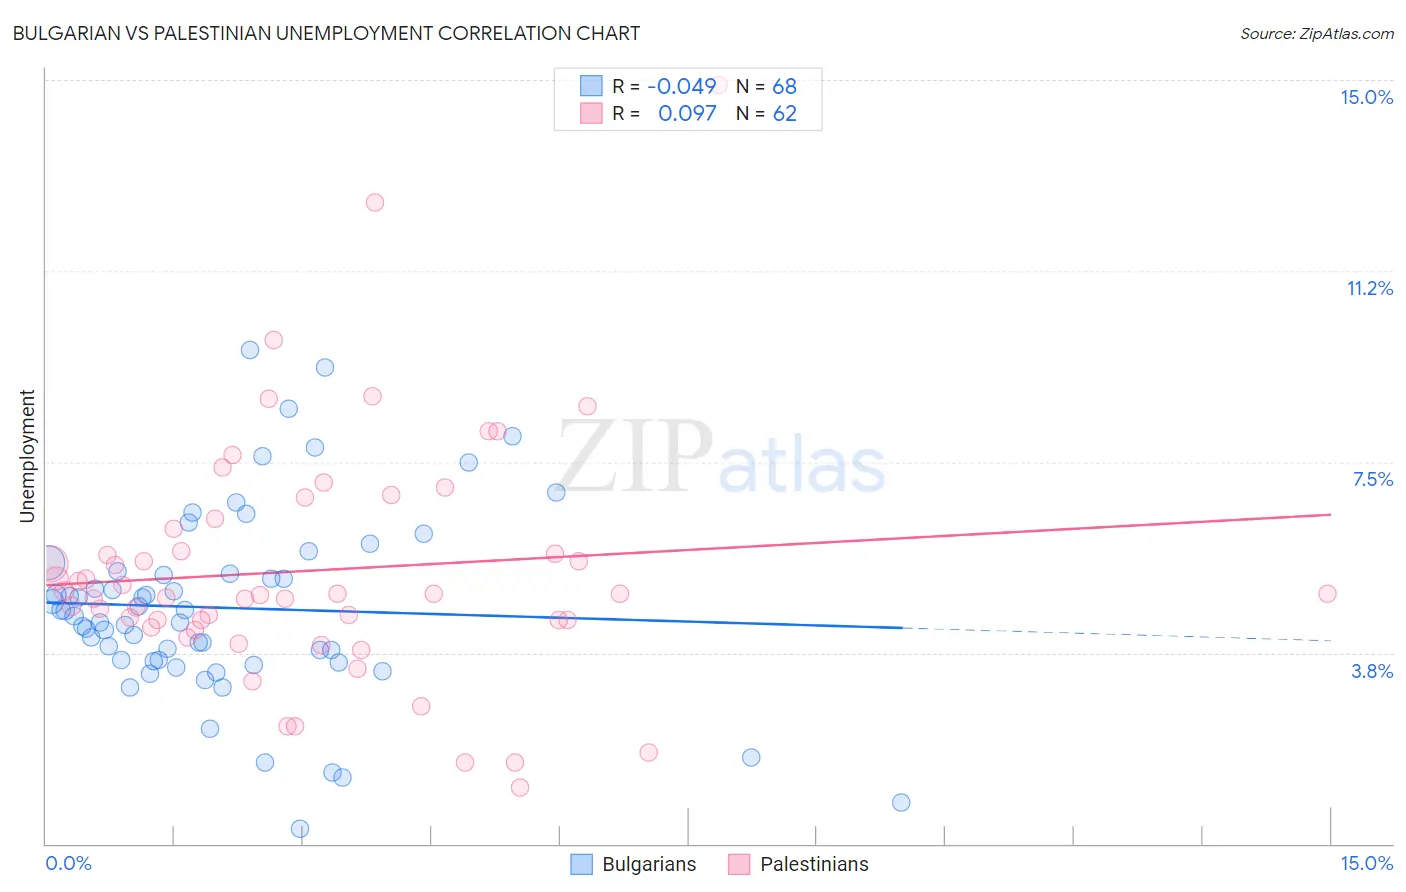
Bulgarian vs Palestinian Unemployment Correlation Chart
The statistical analysis conducted on geographies consisting of 205,555,783 people shows no correlation between the proportion of Bulgarians and unemployment in the United States with a correlation coefficient (R) of -0.049 and weighted average of 4.7%. Similarly, the statistical analysis conducted on geographies consisting of 216,422,149 people shows a slight positive correlation between the proportion of Palestinians and unemployment in the United States with a correlation coefficient (R) of 0.097 and weighted average of 5.1%, a difference of 8.8%.
Unemployment Correlation Summary
| Measurement | Bulgarian | Palestinian |
| Minimum | 0.30% | 1.1% |
| Maximum | 9.7% | 14.9% |
| Range | 9.4% | 13.8% |
| Mean | 4.6% | 5.4% |
| Median | 4.5% | 4.9% |
| Interquartile 25% (IQ1) | 3.6% | 4.4% |
| Interquartile 75% (IQ3) | 5.3% | 6.2% |
| Interquartile Range (IQR) | 1.7% | 1.8% |
| Standard Deviation (Sample) | 1.9% | 2.4% |
| Standard Deviation (Population) | 1.8% | 2.4% |
Similar Demographics by Unemployment
Demographics Similar to Bulgarians by Unemployment
In terms of unemployment, the demographic groups most similar to Bulgarians are Latvian (4.7%, a difference of 0.040%), Venezuelan (4.7%, a difference of 0.11%), British (4.7%, a difference of 0.19%), Finnish (4.7%, a difference of 0.21%), and Welsh (4.7%, a difference of 0.49%).
| Demographics | Rating | Rank | Unemployment |
| Scottish | 99.9 /100 | #19 | Exceptional 4.7% |
| Carpatho Rusyns | 99.9 /100 | #20 | Exceptional 4.7% |
| Welsh | 99.9 /100 | #21 | Exceptional 4.7% |
| Thais | 99.9 /100 | #22 | Exceptional 4.7% |
| British | 99.9 /100 | #23 | Exceptional 4.7% |
| Venezuelans | 99.9 /100 | #24 | Exceptional 4.7% |
| Latvians | 99.9 /100 | #25 | Exceptional 4.7% |
| Bulgarians | 99.9 /100 | #26 | Exceptional 4.7% |
| Finns | 99.9 /100 | #27 | Exceptional 4.7% |
| Cubans | 99.8 /100 | #28 | Exceptional 4.7% |
| Poles | 99.8 /100 | #29 | Exceptional 4.7% |
| Irish | 99.8 /100 | #30 | Exceptional 4.8% |
| Croatians | 99.8 /100 | #31 | Exceptional 4.8% |
| Zimbabweans | 99.8 /100 | #32 | Exceptional 4.8% |
| Sudanese | 99.8 /100 | #33 | Exceptional 4.8% |
Demographics Similar to Palestinians by Unemployment
In terms of unemployment, the demographic groups most similar to Palestinians are Immigrants from Pakistan (5.1%, a difference of 0.020%), Immigrants from Chile (5.1%, a difference of 0.070%), Immigrants from Denmark (5.1%, a difference of 0.11%), Indonesian (5.1%, a difference of 0.12%), and Immigrants from Norway (5.1%, a difference of 0.17%).
| Demographics | Rating | Rank | Unemployment |
| Immigrants | Europe | 86.3 /100 | #134 | Excellent 5.1% |
| Immigrants | Burma/Myanmar | 86.2 /100 | #135 | Excellent 5.1% |
| Immigrants | Spain | 86.2 /100 | #136 | Excellent 5.1% |
| Immigrants | Saudi Arabia | 85.6 /100 | #137 | Excellent 5.1% |
| Immigrants | Hungary | 85.6 /100 | #138 | Excellent 5.1% |
| Pakistanis | 85.3 /100 | #139 | Excellent 5.1% |
| Immigrants | Denmark | 84.3 /100 | #140 | Excellent 5.1% |
| Palestinians | 83.4 /100 | #141 | Excellent 5.1% |
| Immigrants | Pakistan | 83.2 /100 | #142 | Excellent 5.1% |
| Immigrants | Chile | 82.8 /100 | #143 | Excellent 5.1% |
| Indonesians | 82.3 /100 | #144 | Excellent 5.1% |
| Immigrants | Norway | 81.8 /100 | #145 | Excellent 5.1% |
| Immigrants | Asia | 81.8 /100 | #146 | Excellent 5.1% |
| Indians (Asian) | 81.6 /100 | #147 | Excellent 5.1% |
| Immigrants | Italy | 79.1 /100 | #148 | Good 5.1% |