Bulgarian vs Czechoslovakian 2 or more Vehicles in Household
COMPARE
Bulgarian
Czechoslovakian
2 or more Vehicles in Household
2 or more Vehicles in Household Comparison
Bulgarians
Czechoslovakians
56.5%
2 OR MORE VEHICLES IN HOUSEHOLD
89.7/ 100
METRIC RATING
131st/ 347
METRIC RANK
59.8%
2 OR MORE VEHICLES IN HOUSEHOLD
100.0/ 100
METRIC RATING
43rd/ 347
METRIC RANK
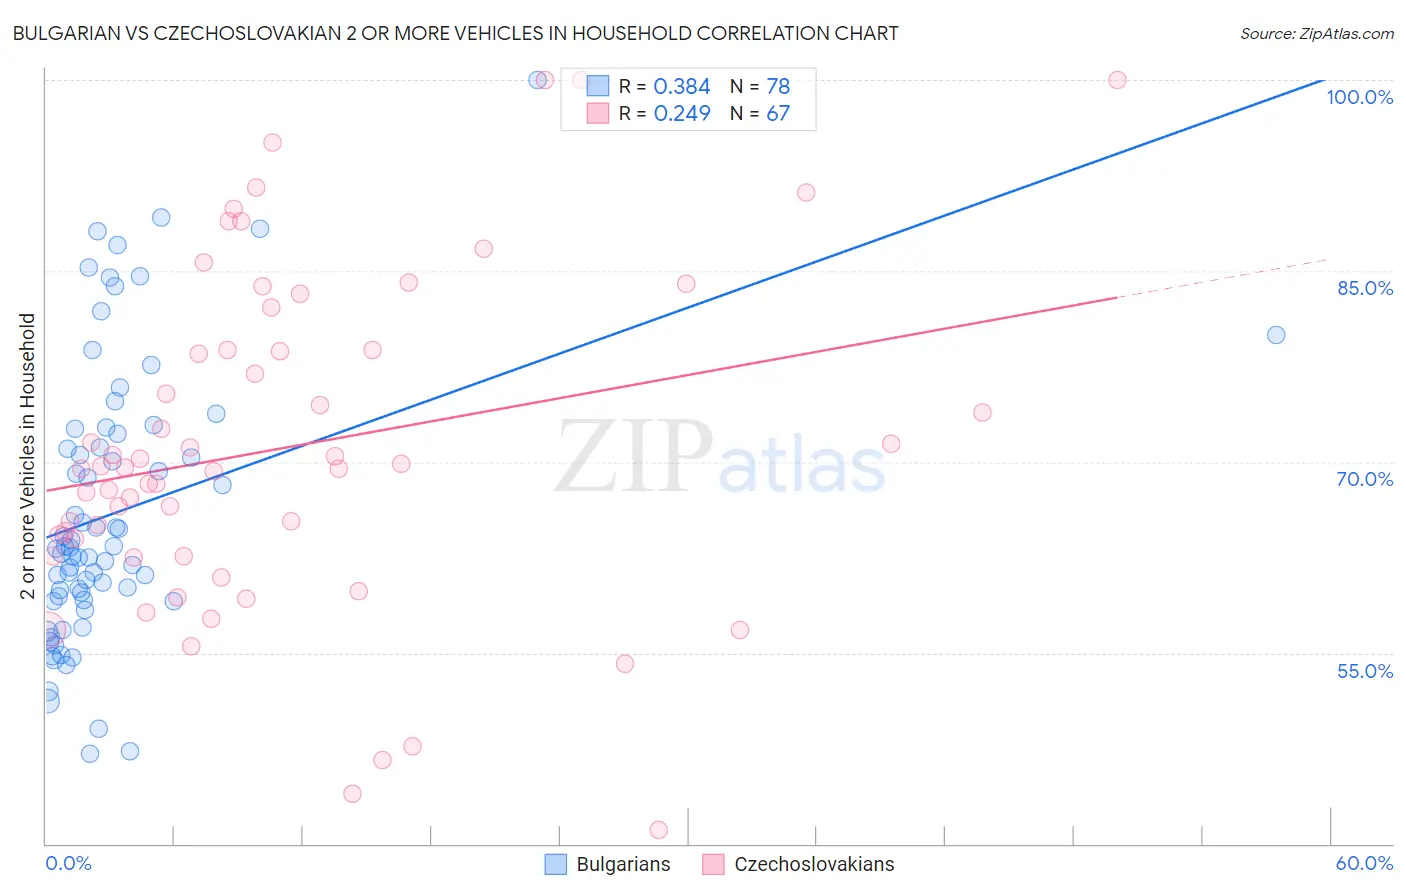
Bulgarian vs Czechoslovakian 2 or more Vehicles in Household Correlation Chart
The statistical analysis conducted on geographies consisting of 205,573,622 people shows a mild positive correlation between the proportion of Bulgarians and percentage of households with 2 or more vehicles available in the United States with a correlation coefficient (R) of 0.384 and weighted average of 56.5%. Similarly, the statistical analysis conducted on geographies consisting of 368,548,443 people shows a weak positive correlation between the proportion of Czechoslovakians and percentage of households with 2 or more vehicles available in the United States with a correlation coefficient (R) of 0.249 and weighted average of 59.8%, a difference of 5.8%.
2 or more Vehicles in Household Correlation Summary
| Measurement | Bulgarian | Czechoslovakian |
| Minimum | 47.1% | 41.1% |
| Maximum | 100.0% | 100.0% |
| Range | 52.9% | 58.9% |
| Mean | 66.1% | 71.2% |
| Median | 63.2% | 69.5% |
| Interquartile 25% (IQ1) | 59.1% | 62.6% |
| Interquartile 75% (IQ3) | 72.2% | 78.8% |
| Interquartile Range (IQR) | 13.1% | 16.2% |
| Standard Deviation (Sample) | 10.9% | 13.2% |
| Standard Deviation (Population) | 10.8% | 13.1% |
Similar Demographics by 2 or more Vehicles in Household
Demographics Similar to Bulgarians by 2 or more Vehicles in Household
In terms of 2 or more vehicles in household, the demographic groups most similar to Bulgarians are Yugoslavian (56.6%, a difference of 0.030%), Hungarian (56.5%, a difference of 0.060%), Ute (56.6%, a difference of 0.070%), Immigrants from South Central Asia (56.6%, a difference of 0.080%), and Immigrants from Thailand (56.6%, a difference of 0.10%).
| Demographics | Rating | Rank | 2 or more Vehicles in Household |
| New Zealanders | 91.8 /100 | #124 | Exceptional 56.7% |
| Tsimshian | 91.6 /100 | #125 | Exceptional 56.7% |
| Estonians | 90.9 /100 | #126 | Exceptional 56.6% |
| Immigrants | Thailand | 90.7 /100 | #127 | Exceptional 56.6% |
| Immigrants | South Central Asia | 90.5 /100 | #128 | Exceptional 56.6% |
| Ute | 90.4 /100 | #129 | Exceptional 56.6% |
| Yugoslavians | 90.0 /100 | #130 | Exceptional 56.6% |
| Bulgarians | 89.7 /100 | #131 | Excellent 56.5% |
| Hungarians | 89.1 /100 | #132 | Excellent 56.5% |
| Comanche | 88.4 /100 | #133 | Excellent 56.5% |
| Immigrants | Azores | 86.6 /100 | #134 | Excellent 56.4% |
| Blackfeet | 86.5 /100 | #135 | Excellent 56.4% |
| Immigrants | Asia | 86.0 /100 | #136 | Excellent 56.3% |
| Cubans | 84.8 /100 | #137 | Excellent 56.3% |
| Salvadorans | 84.7 /100 | #138 | Excellent 56.3% |
Demographics Similar to Czechoslovakians by 2 or more Vehicles in Household
In terms of 2 or more vehicles in household, the demographic groups most similar to Czechoslovakians are French (59.8%, a difference of 0.060%), Malaysian (59.8%, a difference of 0.080%), Northern European (59.9%, a difference of 0.090%), Immigrants from Taiwan (59.7%, a difference of 0.10%), and Cherokee (59.9%, a difference of 0.11%).
| Demographics | Rating | Rank | 2 or more Vehicles in Household |
| Chinese | 100.0 /100 | #36 | Exceptional 60.1% |
| Irish | 100.0 /100 | #37 | Exceptional 60.1% |
| Americans | 100.0 /100 | #38 | Exceptional 60.0% |
| British | 100.0 /100 | #39 | Exceptional 60.0% |
| Cherokee | 100.0 /100 | #40 | Exceptional 59.9% |
| Northern Europeans | 100.0 /100 | #41 | Exceptional 59.9% |
| Malaysians | 100.0 /100 | #42 | Exceptional 59.8% |
| Czechoslovakians | 100.0 /100 | #43 | Exceptional 59.8% |
| French | 100.0 /100 | #44 | Exceptional 59.8% |
| Immigrants | Taiwan | 100.0 /100 | #45 | Exceptional 59.7% |
| Immigrants | South Eastern Asia | 100.0 /100 | #46 | Exceptional 59.6% |
| Yaqui | 99.9 /100 | #47 | Exceptional 59.3% |
| Immigrants | India | 99.9 /100 | #48 | Exceptional 59.3% |
| Belgians | 99.9 /100 | #49 | Exceptional 59.3% |
| Choctaw | 99.9 /100 | #50 | Exceptional 59.3% |