Apache vs Guamanian/Chamorro Child Poverty Among Boys Under 16
COMPARE
Apache
Guamanian/Chamorro
Child Poverty Among Boys Under 16
Child Poverty Among Boys Under 16 Comparison
Apache
Guamanians/Chamorros
24.5%
CHILD POVERTY AMONG BOYS UNDER 16
0.0/ 100
METRIC RATING
333rd/ 347
METRIC RANK
16.1%
CHILD POVERTY AMONG BOYS UNDER 16
69.6/ 100
METRIC RATING
162nd/ 347
METRIC RANK
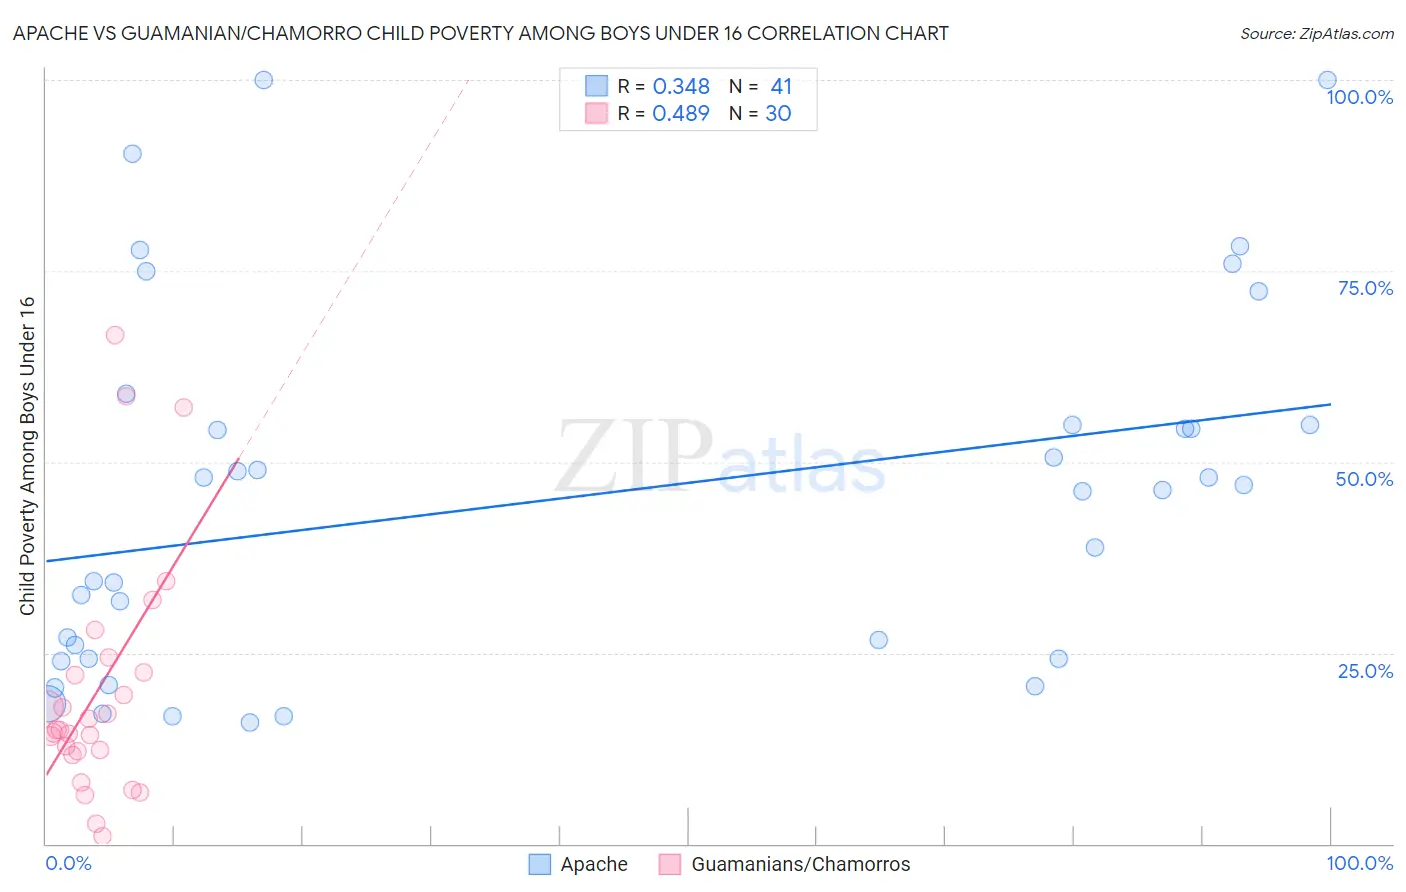
Apache vs Guamanian/Chamorro Child Poverty Among Boys Under 16 Correlation Chart
The statistical analysis conducted on geographies consisting of 229,742,001 people shows a mild positive correlation between the proportion of Apache and poverty level among boys under the age of 16 in the United States with a correlation coefficient (R) of 0.348 and weighted average of 24.5%. Similarly, the statistical analysis conducted on geographies consisting of 220,488,068 people shows a moderate positive correlation between the proportion of Guamanians/Chamorros and poverty level among boys under the age of 16 in the United States with a correlation coefficient (R) of 0.489 and weighted average of 16.1%, a difference of 52.6%.
Child Poverty Among Boys Under 16 Correlation Summary
| Measurement | Apache | Guamanian/Chamorro |
| Minimum | 15.9% | 1.0% |
| Maximum | 100.0% | 66.7% |
| Range | 84.1% | 65.6% |
| Mean | 45.2% | 20.1% |
| Median | 46.3% | 14.9% |
| Interquartile 25% (IQ1) | 24.3% | 12.0% |
| Interquartile 75% (IQ3) | 54.8% | 22.4% |
| Interquartile Range (IQR) | 30.6% | 10.3% |
| Standard Deviation (Sample) | 23.6% | 15.8% |
| Standard Deviation (Population) | 23.3% | 15.6% |
Similar Demographics by Child Poverty Among Boys Under 16
Demographics Similar to Apache by Child Poverty Among Boys Under 16
In terms of child poverty among boys under 16, the demographic groups most similar to Apache are Black/African American (24.5%, a difference of 0.12%), Immigrants from Dominican Republic (24.3%, a difference of 0.72%), Yup'ik (24.7%, a difference of 0.97%), Dominican (24.2%, a difference of 1.3%), and Colville (24.1%, a difference of 1.7%).
| Demographics | Rating | Rank | Child Poverty Among Boys Under 16 |
| Paiute | 0.0 /100 | #326 | Tragic 22.8% |
| Immigrants | Honduras | 0.0 /100 | #327 | Tragic 22.8% |
| Pueblo | 0.0 /100 | #328 | Tragic 23.5% |
| Natives/Alaskans | 0.0 /100 | #329 | Tragic 24.0% |
| Colville | 0.0 /100 | #330 | Tragic 24.1% |
| Dominicans | 0.0 /100 | #331 | Tragic 24.2% |
| Immigrants | Dominican Republic | 0.0 /100 | #332 | Tragic 24.3% |
| Apache | 0.0 /100 | #333 | Tragic 24.5% |
| Blacks/African Americans | 0.0 /100 | #334 | Tragic 24.5% |
| Yup'ik | 0.0 /100 | #335 | Tragic 24.7% |
| Sioux | 0.0 /100 | #336 | Tragic 25.3% |
| Cheyenne | 0.0 /100 | #337 | Tragic 25.8% |
| Hopi | 0.0 /100 | #338 | Tragic 25.9% |
| Houma | 0.0 /100 | #339 | Tragic 26.2% |
| Crow | 0.0 /100 | #340 | Tragic 26.3% |
Demographics Similar to Guamanians/Chamorros by Child Poverty Among Boys Under 16
In terms of child poverty among boys under 16, the demographic groups most similar to Guamanians/Chamorros are Costa Rican (16.1%, a difference of 0.20%), Immigrants from Albania (16.1%, a difference of 0.22%), Immigrants from Oceania (16.0%, a difference of 0.23%), Immigrants from Northern Africa (16.0%, a difference of 0.24%), and Colombian (16.1%, a difference of 0.58%).
| Demographics | Rating | Rank | Child Poverty Among Boys Under 16 |
| French Canadians | 76.6 /100 | #155 | Good 15.9% |
| Israelis | 76.5 /100 | #156 | Good 15.9% |
| Immigrants | Nepal | 76.0 /100 | #157 | Good 15.9% |
| Yugoslavians | 75.9 /100 | #158 | Good 15.9% |
| Immigrants | Chile | 74.8 /100 | #159 | Good 15.9% |
| Immigrants | Northern Africa | 71.3 /100 | #160 | Good 16.0% |
| Immigrants | Oceania | 71.3 /100 | #161 | Good 16.0% |
| Guamanians/Chamorros | 69.6 /100 | #162 | Good 16.1% |
| Costa Ricans | 68.1 /100 | #163 | Good 16.1% |
| Immigrants | Albania | 67.9 /100 | #164 | Good 16.1% |
| Colombians | 65.2 /100 | #165 | Good 16.1% |
| Immigrants | Germany | 63.6 /100 | #166 | Good 16.2% |
| Afghans | 55.4 /100 | #167 | Average 16.3% |
| South Americans | 55.3 /100 | #168 | Average 16.3% |
| Immigrants | Saudi Arabia | 53.6 /100 | #169 | Average 16.4% |