Immigrants from Zimbabwe vs Guamanian/Chamorro Male Unemployment
COMPARE
Immigrants from Zimbabwe
Guamanian/Chamorro
Male Unemployment
Male Unemployment Comparison
Immigrants from Zimbabwe
Guamanians/Chamorros
4.9%
MALE UNEMPLOYMENT
99.0/ 100
METRIC RATING
45th/ 347
METRIC RANK
5.4%
MALE UNEMPLOYMENT
12.3/ 100
METRIC RATING
204th/ 347
METRIC RANK
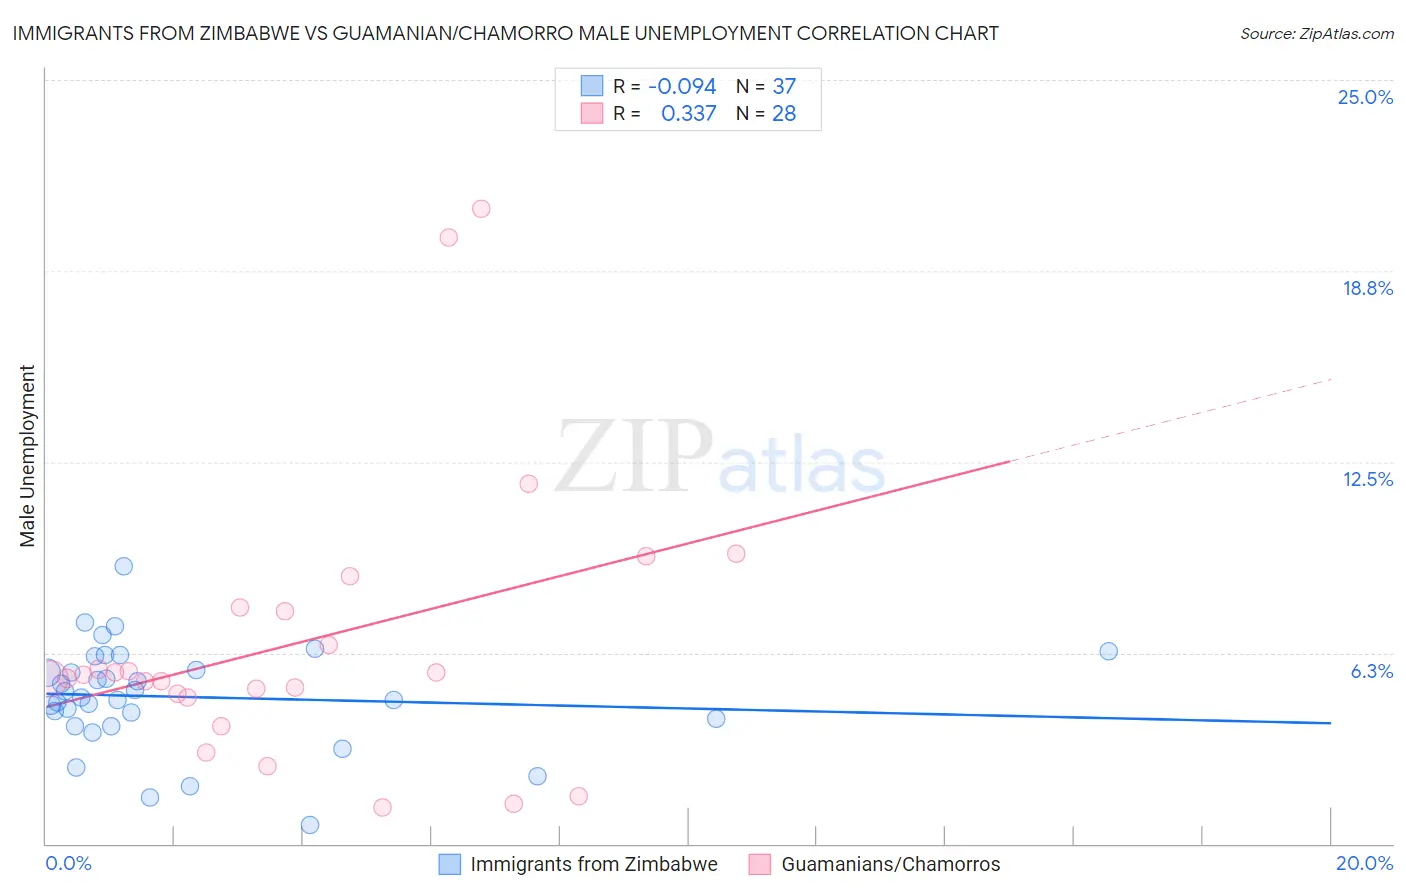
Immigrants from Zimbabwe vs Guamanian/Chamorro Male Unemployment Correlation Chart
The statistical analysis conducted on geographies consisting of 117,685,167 people shows a slight negative correlation between the proportion of Immigrants from Zimbabwe and unemployment rate among males in the United States with a correlation coefficient (R) of -0.094 and weighted average of 4.9%. Similarly, the statistical analysis conducted on geographies consisting of 221,364,428 people shows a mild positive correlation between the proportion of Guamanians/Chamorros and unemployment rate among males in the United States with a correlation coefficient (R) of 0.337 and weighted average of 5.4%, a difference of 10.3%.
Male Unemployment Correlation Summary
| Measurement | Immigrants from Zimbabwe | Guamanian/Chamorro |
| Minimum | 0.60% | 1.2% |
| Maximum | 9.1% | 20.8% |
| Range | 8.5% | 19.6% |
| Mean | 4.8% | 6.6% |
| Median | 4.8% | 5.5% |
| Interquartile 25% (IQ1) | 4.0% | 4.9% |
| Interquartile 75% (IQ3) | 5.9% | 7.7% |
| Interquartile Range (IQR) | 1.9% | 2.8% |
| Standard Deviation (Sample) | 1.7% | 4.6% |
| Standard Deviation (Population) | 1.7% | 4.5% |
Similar Demographics by Male Unemployment
Demographics Similar to Immigrants from Zimbabwe by Male Unemployment
In terms of male unemployment, the demographic groups most similar to Immigrants from Zimbabwe are Bhutanese (4.9%, a difference of 0.090%), Immigrants from Korea (4.9%, a difference of 0.15%), Austrian (4.9%, a difference of 0.16%), Immigrants from Scotland (4.9%, a difference of 0.18%), and Polish (4.9%, a difference of 0.19%).
| Demographics | Rating | Rank | Male Unemployment |
| Immigrants | Bosnia and Herzegovina | 99.4 /100 | #38 | Exceptional 4.9% |
| Burmese | 99.3 /100 | #39 | Exceptional 4.9% |
| Northern Europeans | 99.3 /100 | #40 | Exceptional 4.9% |
| Chinese | 99.3 /100 | #41 | Exceptional 4.9% |
| Immigrants | Belgium | 99.2 /100 | #42 | Exceptional 4.9% |
| Immigrants | Japan | 99.2 /100 | #43 | Exceptional 4.9% |
| Immigrants | Korea | 99.1 /100 | #44 | Exceptional 4.9% |
| Immigrants | Zimbabwe | 99.0 /100 | #45 | Exceptional 4.9% |
| Bhutanese | 98.9 /100 | #46 | Exceptional 4.9% |
| Austrians | 98.9 /100 | #47 | Exceptional 4.9% |
| Immigrants | Scotland | 98.9 /100 | #48 | Exceptional 4.9% |
| Poles | 98.9 /100 | #49 | Exceptional 4.9% |
| Croatians | 98.9 /100 | #50 | Exceptional 4.9% |
| Slovenes | 98.8 /100 | #51 | Exceptional 5.0% |
| Irish | 98.8 /100 | #52 | Exceptional 5.0% |
Demographics Similar to Guamanians/Chamorros by Male Unemployment
In terms of male unemployment, the demographic groups most similar to Guamanians/Chamorros are Immigrants from Laos (5.4%, a difference of 0.090%), Nonimmigrants (5.4%, a difference of 0.10%), Immigrants from Costa Rica (5.5%, a difference of 0.13%), Immigrants from Philippines (5.4%, a difference of 0.15%), and Immigrants from Zaire (5.4%, a difference of 0.17%).
| Demographics | Rating | Rank | Male Unemployment |
| Alsatians | 16.7 /100 | #197 | Poor 5.4% |
| Immigrants | Thailand | 14.7 /100 | #198 | Poor 5.4% |
| Immigrants | Greece | 14.5 /100 | #199 | Poor 5.4% |
| Immigrants | Zaire | 13.7 /100 | #200 | Poor 5.4% |
| Immigrants | Philippines | 13.5 /100 | #201 | Poor 5.4% |
| Immigrants | Nonimmigrants | 13.1 /100 | #202 | Poor 5.4% |
| Immigrants | Laos | 13.0 /100 | #203 | Poor 5.4% |
| Guamanians/Chamorros | 12.3 /100 | #204 | Poor 5.4% |
| Immigrants | Costa Rica | 11.4 /100 | #205 | Poor 5.5% |
| Immigrants | Ukraine | 9.9 /100 | #206 | Tragic 5.5% |
| Immigrants | Syria | 9.3 /100 | #207 | Tragic 5.5% |
| Immigrants | Lebanon | 8.6 /100 | #208 | Tragic 5.5% |
| Immigrants | Middle Africa | 8.3 /100 | #209 | Tragic 5.5% |
| South American Indians | 7.6 /100 | #210 | Tragic 5.5% |
| Israelis | 7.4 /100 | #211 | Tragic 5.5% |