Danish vs Guamanian/Chamorro Male Unemployment
COMPARE
Danish
Guamanian/Chamorro
Male Unemployment
Male Unemployment Comparison
Danes
Guamanians/Chamorros
4.5%
MALE UNEMPLOYMENT
100.0/ 100
METRIC RATING
5th/ 347
METRIC RANK
5.4%
MALE UNEMPLOYMENT
12.3/ 100
METRIC RATING
204th/ 347
METRIC RANK
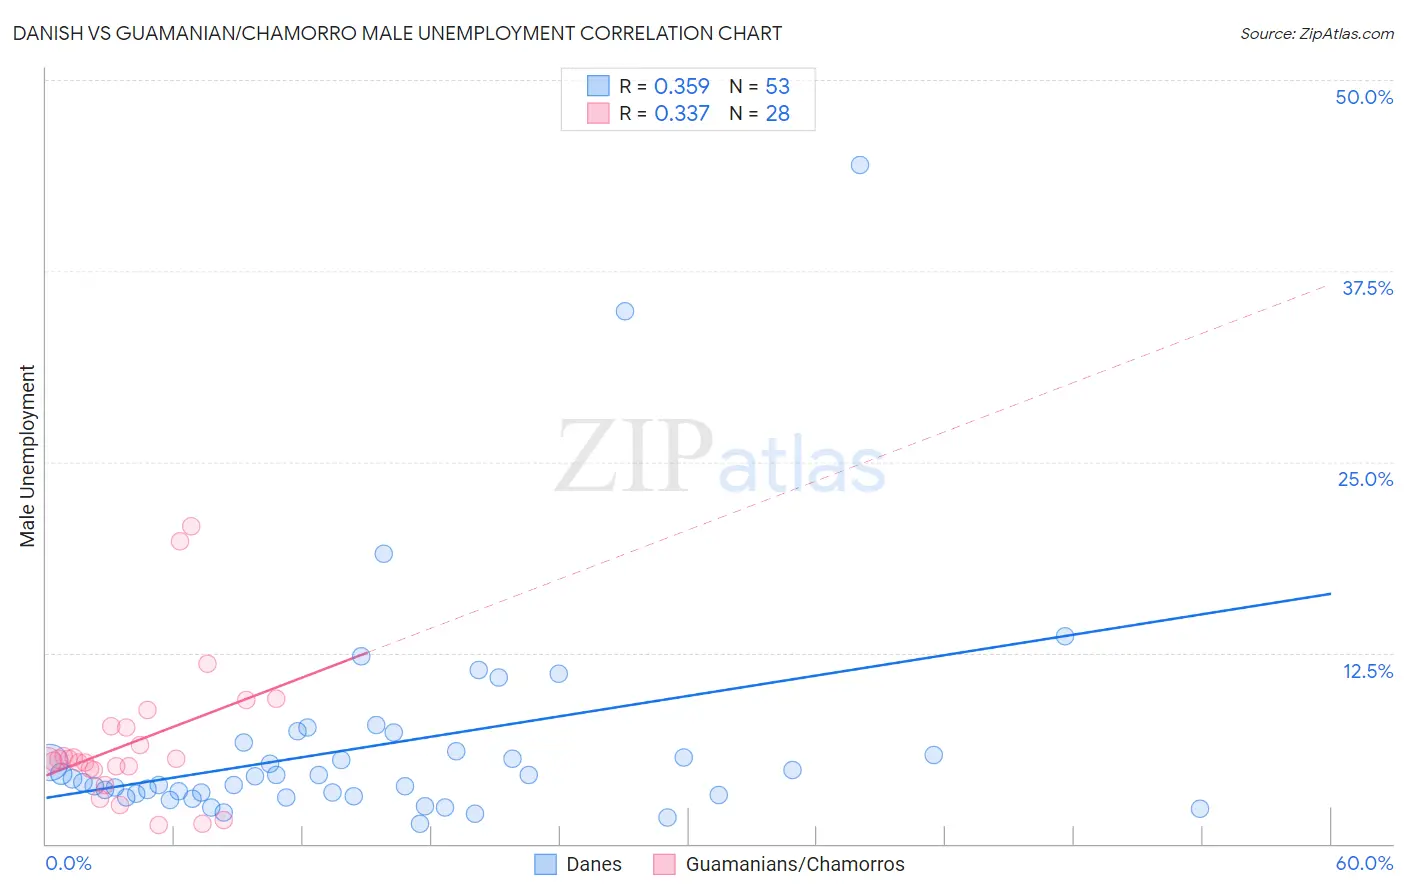
Danish vs Guamanian/Chamorro Male Unemployment Correlation Chart
The statistical analysis conducted on geographies consisting of 469,242,434 people shows a mild positive correlation between the proportion of Danes and unemployment rate among males in the United States with a correlation coefficient (R) of 0.359 and weighted average of 4.5%. Similarly, the statistical analysis conducted on geographies consisting of 221,364,428 people shows a mild positive correlation between the proportion of Guamanians/Chamorros and unemployment rate among males in the United States with a correlation coefficient (R) of 0.337 and weighted average of 5.4%, a difference of 21.1%.
Male Unemployment Correlation Summary
| Measurement | Danish | Guamanian/Chamorro |
| Minimum | 1.3% | 1.2% |
| Maximum | 44.4% | 20.8% |
| Range | 43.1% | 19.6% |
| Mean | 6.5% | 6.6% |
| Median | 4.3% | 5.5% |
| Interquartile 25% (IQ1) | 3.1% | 4.9% |
| Interquartile 75% (IQ3) | 6.3% | 7.7% |
| Interquartile Range (IQR) | 3.2% | 2.8% |
| Standard Deviation (Sample) | 7.5% | 4.6% |
| Standard Deviation (Population) | 7.4% | 4.5% |
Similar Demographics by Male Unemployment
Demographics Similar to Danes by Male Unemployment
In terms of male unemployment, the demographic groups most similar to Danes are Venezuelan (4.5%, a difference of 0.45%), Czech (4.5%, a difference of 0.65%), Luxembourger (4.5%, a difference of 0.91%), Immigrants from Venezuela (4.4%, a difference of 1.0%), and Norwegian (4.4%, a difference of 1.4%).
| Demographics | Rating | Rank | Male Unemployment |
| Immigrants | India | 100.0 /100 | #1 | Exceptional 4.4% |
| Immigrants | Cuba | 100.0 /100 | #2 | Exceptional 4.4% |
| Norwegians | 100.0 /100 | #3 | Exceptional 4.4% |
| Immigrants | Venezuela | 100.0 /100 | #4 | Exceptional 4.4% |
| Danes | 100.0 /100 | #5 | Exceptional 4.5% |
| Venezuelans | 100.0 /100 | #6 | Exceptional 4.5% |
| Czechs | 100.0 /100 | #7 | Exceptional 4.5% |
| Luxembourgers | 100.0 /100 | #8 | Exceptional 4.5% |
| Thais | 100.0 /100 | #9 | Exceptional 4.6% |
| Cubans | 100.0 /100 | #10 | Exceptional 4.6% |
| Swedes | 100.0 /100 | #11 | Exceptional 4.6% |
| Immigrants | Bolivia | 100.0 /100 | #12 | Exceptional 4.7% |
| Bolivians | 100.0 /100 | #13 | Exceptional 4.7% |
| Germans | 100.0 /100 | #14 | Exceptional 4.7% |
| Scandinavians | 100.0 /100 | #15 | Exceptional 4.7% |
Demographics Similar to Guamanians/Chamorros by Male Unemployment
In terms of male unemployment, the demographic groups most similar to Guamanians/Chamorros are Immigrants from Laos (5.4%, a difference of 0.090%), Nonimmigrants (5.4%, a difference of 0.10%), Immigrants from Costa Rica (5.5%, a difference of 0.13%), Immigrants from Philippines (5.4%, a difference of 0.15%), and Immigrants from Zaire (5.4%, a difference of 0.17%).
| Demographics | Rating | Rank | Male Unemployment |
| Alsatians | 16.7 /100 | #197 | Poor 5.4% |
| Immigrants | Thailand | 14.7 /100 | #198 | Poor 5.4% |
| Immigrants | Greece | 14.5 /100 | #199 | Poor 5.4% |
| Immigrants | Zaire | 13.7 /100 | #200 | Poor 5.4% |
| Immigrants | Philippines | 13.5 /100 | #201 | Poor 5.4% |
| Immigrants | Nonimmigrants | 13.1 /100 | #202 | Poor 5.4% |
| Immigrants | Laos | 13.0 /100 | #203 | Poor 5.4% |
| Guamanians/Chamorros | 12.3 /100 | #204 | Poor 5.4% |
| Immigrants | Costa Rica | 11.4 /100 | #205 | Poor 5.5% |
| Immigrants | Ukraine | 9.9 /100 | #206 | Tragic 5.5% |
| Immigrants | Syria | 9.3 /100 | #207 | Tragic 5.5% |
| Immigrants | Lebanon | 8.6 /100 | #208 | Tragic 5.5% |
| Immigrants | Middle Africa | 8.3 /100 | #209 | Tragic 5.5% |
| South American Indians | 7.6 /100 | #210 | Tragic 5.5% |
| Israelis | 7.4 /100 | #211 | Tragic 5.5% |