African vs Immigrants from Taiwan Male Unemployment
COMPARE
African
Immigrants from Taiwan
Male Unemployment
Male Unemployment Comparison
Africans
Immigrants from Taiwan
6.3%
MALE UNEMPLOYMENT
0.0/ 100
METRIC RATING
286th/ 347
METRIC RANK
4.8%
MALE UNEMPLOYMENT
99.9/ 100
METRIC RATING
21st/ 347
METRIC RANK
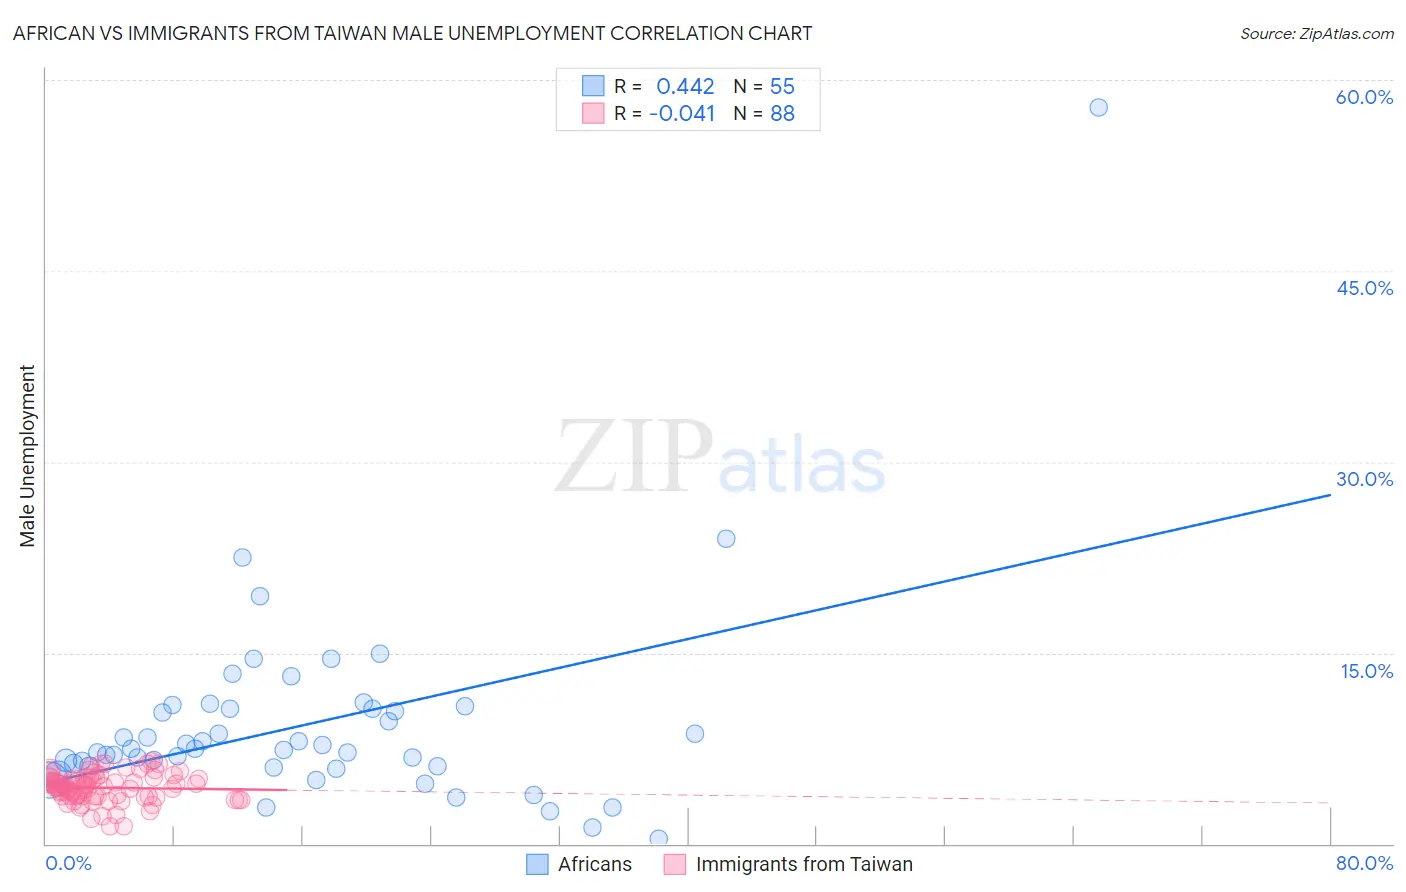
African vs Immigrants from Taiwan Male Unemployment Correlation Chart
The statistical analysis conducted on geographies consisting of 467,193,011 people shows a moderate positive correlation between the proportion of Africans and unemployment rate among males in the United States with a correlation coefficient (R) of 0.442 and weighted average of 6.3%. Similarly, the statistical analysis conducted on geographies consisting of 297,680,447 people shows no correlation between the proportion of Immigrants from Taiwan and unemployment rate among males in the United States with a correlation coefficient (R) of -0.041 and weighted average of 4.8%, a difference of 31.2%.
Male Unemployment Correlation Summary
| Measurement | African | Immigrants from Taiwan |
| Minimum | 0.40% | 1.4% |
| Maximum | 57.8% | 6.5% |
| Range | 57.4% | 5.1% |
| Mean | 9.3% | 4.4% |
| Median | 7.5% | 4.5% |
| Interquartile 25% (IQ1) | 6.1% | 3.7% |
| Interquartile 75% (IQ3) | 10.6% | 5.1% |
| Interquartile Range (IQR) | 4.5% | 1.4% |
| Standard Deviation (Sample) | 8.1% | 1.1% |
| Standard Deviation (Population) | 8.0% | 1.1% |
Similar Demographics by Male Unemployment
Demographics Similar to Africans by Male Unemployment
In terms of male unemployment, the demographic groups most similar to Africans are Central American Indian (6.3%, a difference of 0.29%), Immigrants from Senegal (6.3%, a difference of 0.33%), Immigrants from Ecuador (6.2%, a difference of 0.43%), Spanish American Indian (6.2%, a difference of 0.45%), and Immigrants from Caribbean (6.3%, a difference of 0.45%).
| Demographics | Rating | Rank | Male Unemployment |
| Ghanaians | 0.0 /100 | #279 | Tragic 6.1% |
| Immigrants | Ghana | 0.0 /100 | #280 | Tragic 6.2% |
| Sierra Leoneans | 0.0 /100 | #281 | Tragic 6.2% |
| Ecuadorians | 0.0 /100 | #282 | Tragic 6.2% |
| Immigrants | Western Africa | 0.0 /100 | #283 | Tragic 6.2% |
| Spanish American Indians | 0.0 /100 | #284 | Tragic 6.2% |
| Immigrants | Ecuador | 0.0 /100 | #285 | Tragic 6.2% |
| Africans | 0.0 /100 | #286 | Tragic 6.3% |
| Central American Indians | 0.0 /100 | #287 | Tragic 6.3% |
| Immigrants | Senegal | 0.0 /100 | #288 | Tragic 6.3% |
| Immigrants | Caribbean | 0.0 /100 | #289 | Tragic 6.3% |
| U.S. Virgin Islanders | 0.0 /100 | #290 | Tragic 6.4% |
| Immigrants | Azores | 0.0 /100 | #291 | Tragic 6.4% |
| Nepalese | 0.0 /100 | #292 | Tragic 6.4% |
| Haitians | 0.0 /100 | #293 | Tragic 6.4% |
Demographics Similar to Immigrants from Taiwan by Male Unemployment
In terms of male unemployment, the demographic groups most similar to Immigrants from Taiwan are Carpatho Rusyn (4.8%, a difference of 0.010%), Tongan (4.8%, a difference of 0.060%), Immigrants from South Central Asia (4.8%, a difference of 0.090%), Pennsylvania German (4.8%, a difference of 0.16%), and Zimbabwean (4.8%, a difference of 0.19%).
| Demographics | Rating | Rank | Male Unemployment |
| Germans | 100.0 /100 | #14 | Exceptional 4.7% |
| Scandinavians | 100.0 /100 | #15 | Exceptional 4.7% |
| Swiss | 99.9 /100 | #16 | Exceptional 4.7% |
| Filipinos | 99.9 /100 | #17 | Exceptional 4.7% |
| English | 99.9 /100 | #18 | Exceptional 4.8% |
| Europeans | 99.9 /100 | #19 | Exceptional 4.8% |
| Pennsylvania Germans | 99.9 /100 | #20 | Exceptional 4.8% |
| Immigrants | Taiwan | 99.9 /100 | #21 | Exceptional 4.8% |
| Carpatho Rusyns | 99.9 /100 | #22 | Exceptional 4.8% |
| Tongans | 99.9 /100 | #23 | Exceptional 4.8% |
| Immigrants | South Central Asia | 99.9 /100 | #24 | Exceptional 4.8% |
| Zimbabweans | 99.9 /100 | #25 | Exceptional 4.8% |
| Dutch | 99.9 /100 | #26 | Exceptional 4.8% |
| Belgians | 99.9 /100 | #27 | Exceptional 4.8% |
| Bulgarians | 99.8 /100 | #28 | Exceptional 4.8% |