African vs Immigrants from Bolivia Male Unemployment
COMPARE
African
Immigrants from Bolivia
Male Unemployment
Male Unemployment Comparison
Africans
Immigrants from Bolivia
6.3%
MALE UNEMPLOYMENT
0.0/ 100
METRIC RATING
286th/ 347
METRIC RANK
4.7%
MALE UNEMPLOYMENT
100.0/ 100
METRIC RATING
12th/ 347
METRIC RANK
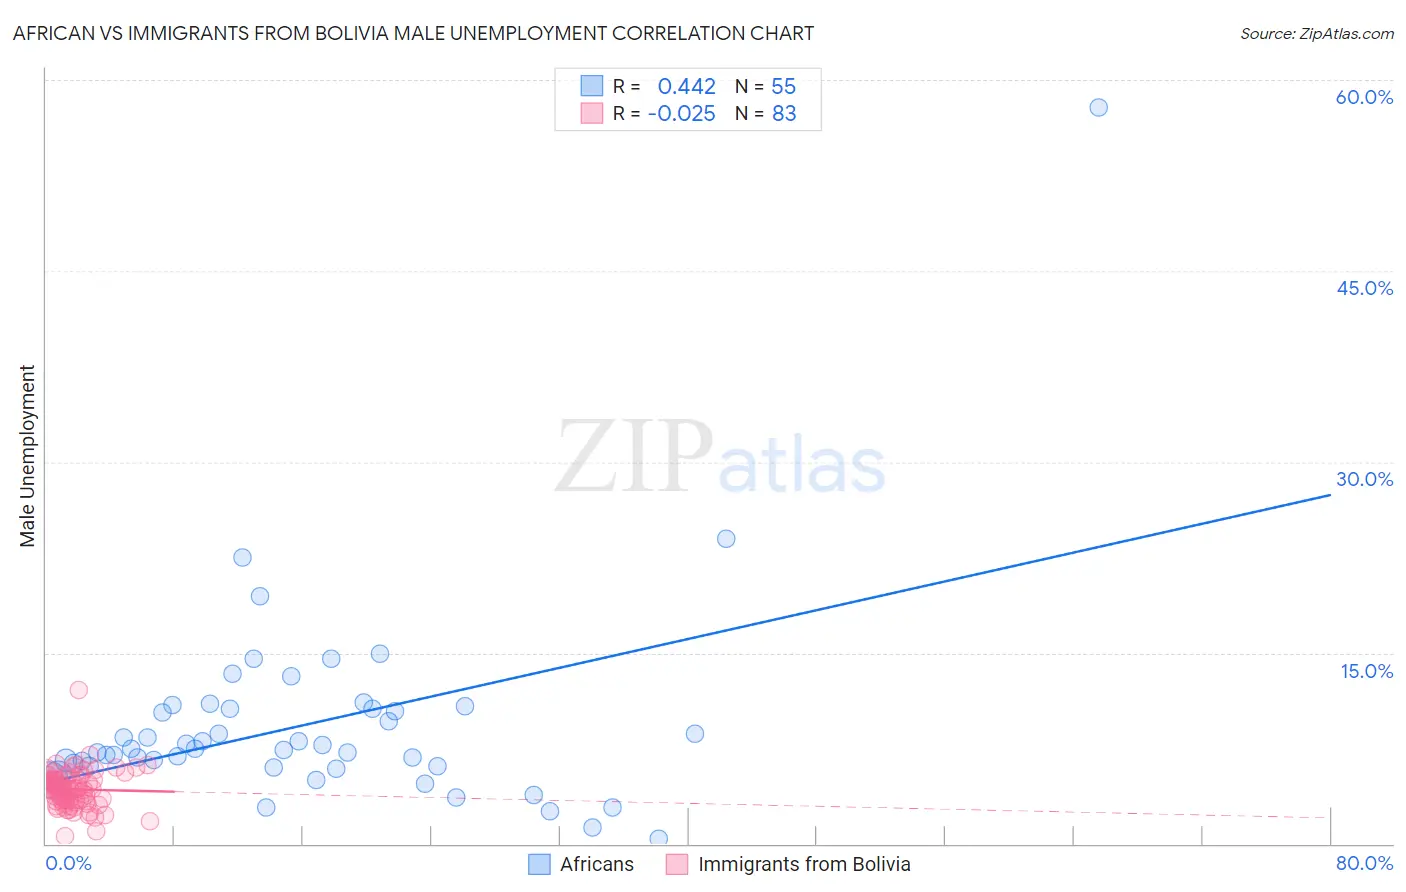
African vs Immigrants from Bolivia Male Unemployment Correlation Chart
The statistical analysis conducted on geographies consisting of 467,193,011 people shows a moderate positive correlation between the proportion of Africans and unemployment rate among males in the United States with a correlation coefficient (R) of 0.442 and weighted average of 6.3%. Similarly, the statistical analysis conducted on geographies consisting of 158,566,605 people shows no correlation between the proportion of Immigrants from Bolivia and unemployment rate among males in the United States with a correlation coefficient (R) of -0.025 and weighted average of 4.7%, a difference of 34.2%.
Male Unemployment Correlation Summary
| Measurement | African | Immigrants from Bolivia |
| Minimum | 0.40% | 0.60% |
| Maximum | 57.8% | 12.1% |
| Range | 57.4% | 11.5% |
| Mean | 9.3% | 4.3% |
| Median | 7.5% | 4.3% |
| Interquartile 25% (IQ1) | 6.1% | 3.4% |
| Interquartile 75% (IQ3) | 10.6% | 5.0% |
| Interquartile Range (IQR) | 4.5% | 1.7% |
| Standard Deviation (Sample) | 8.1% | 1.5% |
| Standard Deviation (Population) | 8.0% | 1.5% |
Similar Demographics by Male Unemployment
Demographics Similar to Africans by Male Unemployment
In terms of male unemployment, the demographic groups most similar to Africans are Central American Indian (6.3%, a difference of 0.29%), Immigrants from Senegal (6.3%, a difference of 0.33%), Immigrants from Ecuador (6.2%, a difference of 0.43%), Spanish American Indian (6.2%, a difference of 0.45%), and Immigrants from Caribbean (6.3%, a difference of 0.45%).
| Demographics | Rating | Rank | Male Unemployment |
| Ghanaians | 0.0 /100 | #279 | Tragic 6.1% |
| Immigrants | Ghana | 0.0 /100 | #280 | Tragic 6.2% |
| Sierra Leoneans | 0.0 /100 | #281 | Tragic 6.2% |
| Ecuadorians | 0.0 /100 | #282 | Tragic 6.2% |
| Immigrants | Western Africa | 0.0 /100 | #283 | Tragic 6.2% |
| Spanish American Indians | 0.0 /100 | #284 | Tragic 6.2% |
| Immigrants | Ecuador | 0.0 /100 | #285 | Tragic 6.2% |
| Africans | 0.0 /100 | #286 | Tragic 6.3% |
| Central American Indians | 0.0 /100 | #287 | Tragic 6.3% |
| Immigrants | Senegal | 0.0 /100 | #288 | Tragic 6.3% |
| Immigrants | Caribbean | 0.0 /100 | #289 | Tragic 6.3% |
| U.S. Virgin Islanders | 0.0 /100 | #290 | Tragic 6.4% |
| Immigrants | Azores | 0.0 /100 | #291 | Tragic 6.4% |
| Nepalese | 0.0 /100 | #292 | Tragic 6.4% |
| Haitians | 0.0 /100 | #293 | Tragic 6.4% |
Demographics Similar to Immigrants from Bolivia by Male Unemployment
In terms of male unemployment, the demographic groups most similar to Immigrants from Bolivia are Bolivian (4.7%, a difference of 0.68%), German (4.7%, a difference of 0.70%), Swedish (4.6%, a difference of 0.73%), Cuban (4.6%, a difference of 0.93%), and Scandinavian (4.7%, a difference of 0.97%).
| Demographics | Rating | Rank | Male Unemployment |
| Danes | 100.0 /100 | #5 | Exceptional 4.5% |
| Venezuelans | 100.0 /100 | #6 | Exceptional 4.5% |
| Czechs | 100.0 /100 | #7 | Exceptional 4.5% |
| Luxembourgers | 100.0 /100 | #8 | Exceptional 4.5% |
| Thais | 100.0 /100 | #9 | Exceptional 4.6% |
| Cubans | 100.0 /100 | #10 | Exceptional 4.6% |
| Swedes | 100.0 /100 | #11 | Exceptional 4.6% |
| Immigrants | Bolivia | 100.0 /100 | #12 | Exceptional 4.7% |
| Bolivians | 100.0 /100 | #13 | Exceptional 4.7% |
| Germans | 100.0 /100 | #14 | Exceptional 4.7% |
| Scandinavians | 100.0 /100 | #15 | Exceptional 4.7% |
| Swiss | 99.9 /100 | #16 | Exceptional 4.7% |
| Filipinos | 99.9 /100 | #17 | Exceptional 4.7% |
| English | 99.9 /100 | #18 | Exceptional 4.8% |
| Europeans | 99.9 /100 | #19 | Exceptional 4.8% |