African vs Immigrants from Burma/Myanmar Male Unemployment
COMPARE
African
Immigrants from Burma/Myanmar
Male Unemployment
Male Unemployment Comparison
Africans
Immigrants from Burma/Myanmar
6.3%
MALE UNEMPLOYMENT
0.0/ 100
METRIC RATING
286th/ 347
METRIC RANK
5.2%
MALE UNEMPLOYMENT
77.5/ 100
METRIC RATING
147th/ 347
METRIC RANK
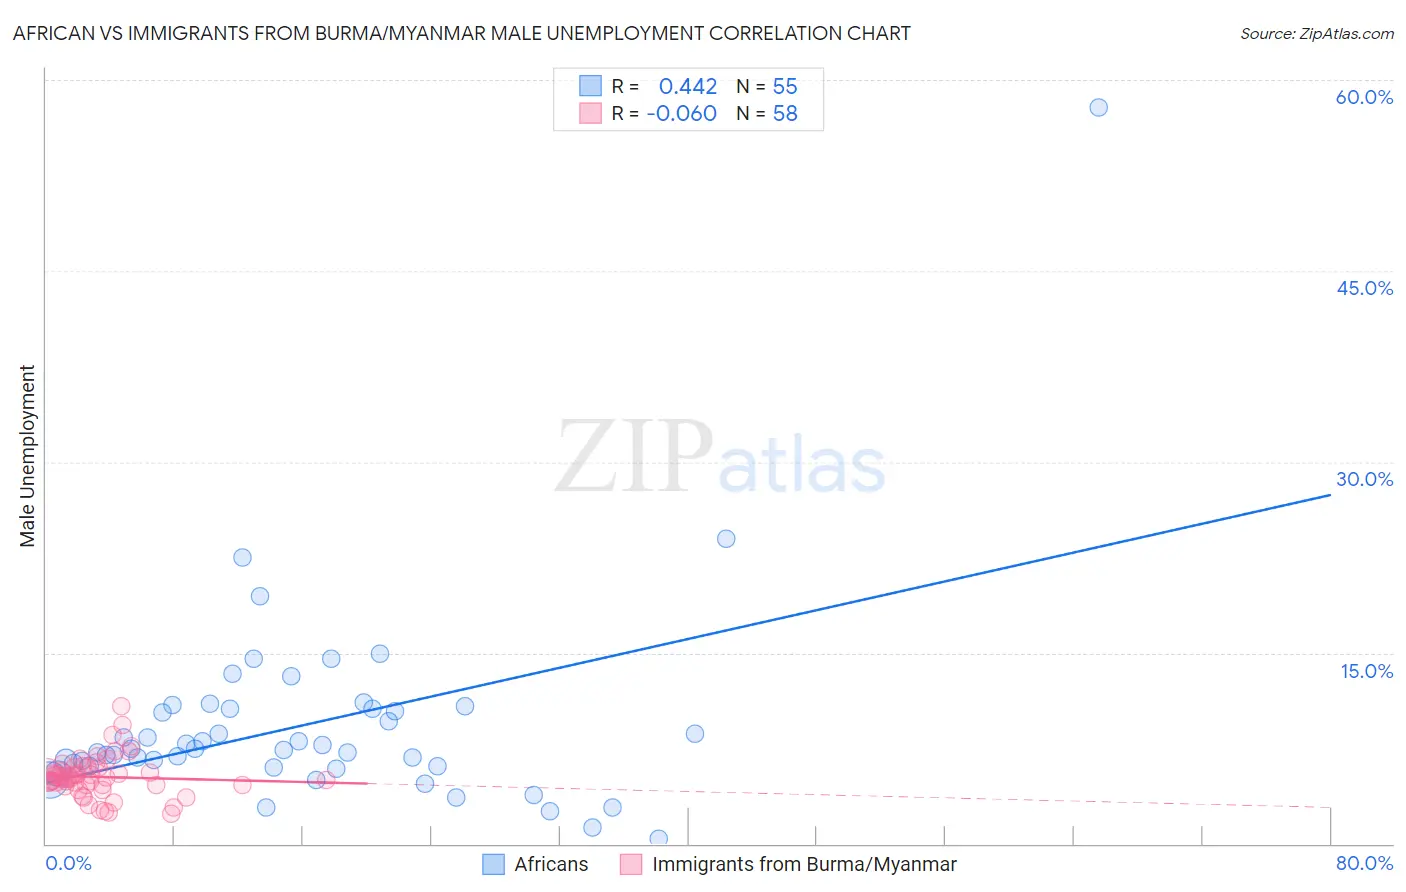
African vs Immigrants from Burma/Myanmar Male Unemployment Correlation Chart
The statistical analysis conducted on geographies consisting of 467,193,011 people shows a moderate positive correlation between the proportion of Africans and unemployment rate among males in the United States with a correlation coefficient (R) of 0.442 and weighted average of 6.3%. Similarly, the statistical analysis conducted on geographies consisting of 172,208,828 people shows a slight negative correlation between the proportion of Immigrants from Burma/Myanmar and unemployment rate among males in the United States with a correlation coefficient (R) of -0.060 and weighted average of 5.2%, a difference of 20.3%.
Male Unemployment Correlation Summary
| Measurement | African | Immigrants from Burma/Myanmar |
| Minimum | 0.40% | 2.4% |
| Maximum | 57.8% | 10.8% |
| Range | 57.4% | 8.4% |
| Mean | 9.3% | 5.3% |
| Median | 7.5% | 5.2% |
| Interquartile 25% (IQ1) | 6.1% | 4.6% |
| Interquartile 75% (IQ3) | 10.6% | 6.0% |
| Interquartile Range (IQR) | 4.5% | 1.4% |
| Standard Deviation (Sample) | 8.1% | 1.6% |
| Standard Deviation (Population) | 8.0% | 1.6% |
Similar Demographics by Male Unemployment
Demographics Similar to Africans by Male Unemployment
In terms of male unemployment, the demographic groups most similar to Africans are Central American Indian (6.3%, a difference of 0.29%), Immigrants from Senegal (6.3%, a difference of 0.33%), Immigrants from Ecuador (6.2%, a difference of 0.43%), Spanish American Indian (6.2%, a difference of 0.45%), and Immigrants from Caribbean (6.3%, a difference of 0.45%).
| Demographics | Rating | Rank | Male Unemployment |
| Ghanaians | 0.0 /100 | #279 | Tragic 6.1% |
| Immigrants | Ghana | 0.0 /100 | #280 | Tragic 6.2% |
| Sierra Leoneans | 0.0 /100 | #281 | Tragic 6.2% |
| Ecuadorians | 0.0 /100 | #282 | Tragic 6.2% |
| Immigrants | Western Africa | 0.0 /100 | #283 | Tragic 6.2% |
| Spanish American Indians | 0.0 /100 | #284 | Tragic 6.2% |
| Immigrants | Ecuador | 0.0 /100 | #285 | Tragic 6.2% |
| Africans | 0.0 /100 | #286 | Tragic 6.3% |
| Central American Indians | 0.0 /100 | #287 | Tragic 6.3% |
| Immigrants | Senegal | 0.0 /100 | #288 | Tragic 6.3% |
| Immigrants | Caribbean | 0.0 /100 | #289 | Tragic 6.3% |
| U.S. Virgin Islanders | 0.0 /100 | #290 | Tragic 6.4% |
| Immigrants | Azores | 0.0 /100 | #291 | Tragic 6.4% |
| Nepalese | 0.0 /100 | #292 | Tragic 6.4% |
| Haitians | 0.0 /100 | #293 | Tragic 6.4% |
Demographics Similar to Immigrants from Burma/Myanmar by Male Unemployment
In terms of male unemployment, the demographic groups most similar to Immigrants from Burma/Myanmar are Immigrants from Kenya (5.2%, a difference of 0.010%), Macedonian (5.2%, a difference of 0.020%), Sri Lankan (5.2%, a difference of 0.030%), Syrian (5.2%, a difference of 0.040%), and Fijian (5.2%, a difference of 0.070%).
| Demographics | Rating | Rank | Male Unemployment |
| Brazilians | 79.3 /100 | #140 | Good 5.2% |
| Immigrants | Switzerland | 79.2 /100 | #141 | Good 5.2% |
| Fijians | 78.3 /100 | #142 | Good 5.2% |
| Syrians | 78.0 /100 | #143 | Good 5.2% |
| Sri Lankans | 77.9 /100 | #144 | Good 5.2% |
| Macedonians | 77.7 /100 | #145 | Good 5.2% |
| Immigrants | Kenya | 77.6 /100 | #146 | Good 5.2% |
| Immigrants | Burma/Myanmar | 77.5 /100 | #147 | Good 5.2% |
| Immigrants | Italy | 76.3 /100 | #148 | Good 5.2% |
| Immigrants | Europe | 76.2 /100 | #149 | Good 5.2% |
| Indians (Asian) | 76.0 /100 | #150 | Good 5.2% |
| Slovaks | 75.5 /100 | #151 | Good 5.2% |
| Egyptians | 74.8 /100 | #152 | Good 5.2% |
| Immigrants | Uruguay | 73.9 /100 | #153 | Good 5.2% |
| Laotians | 73.8 /100 | #154 | Good 5.2% |