African vs Immigrants from Mexico Male Unemployment
COMPARE
African
Immigrants from Mexico
Male Unemployment
Male Unemployment Comparison
Africans
Immigrants from Mexico
6.3%
MALE UNEMPLOYMENT
0.0/ 100
METRIC RATING
286th/ 347
METRIC RANK
5.9%
MALE UNEMPLOYMENT
0.0/ 100
METRIC RATING
264th/ 347
METRIC RANK
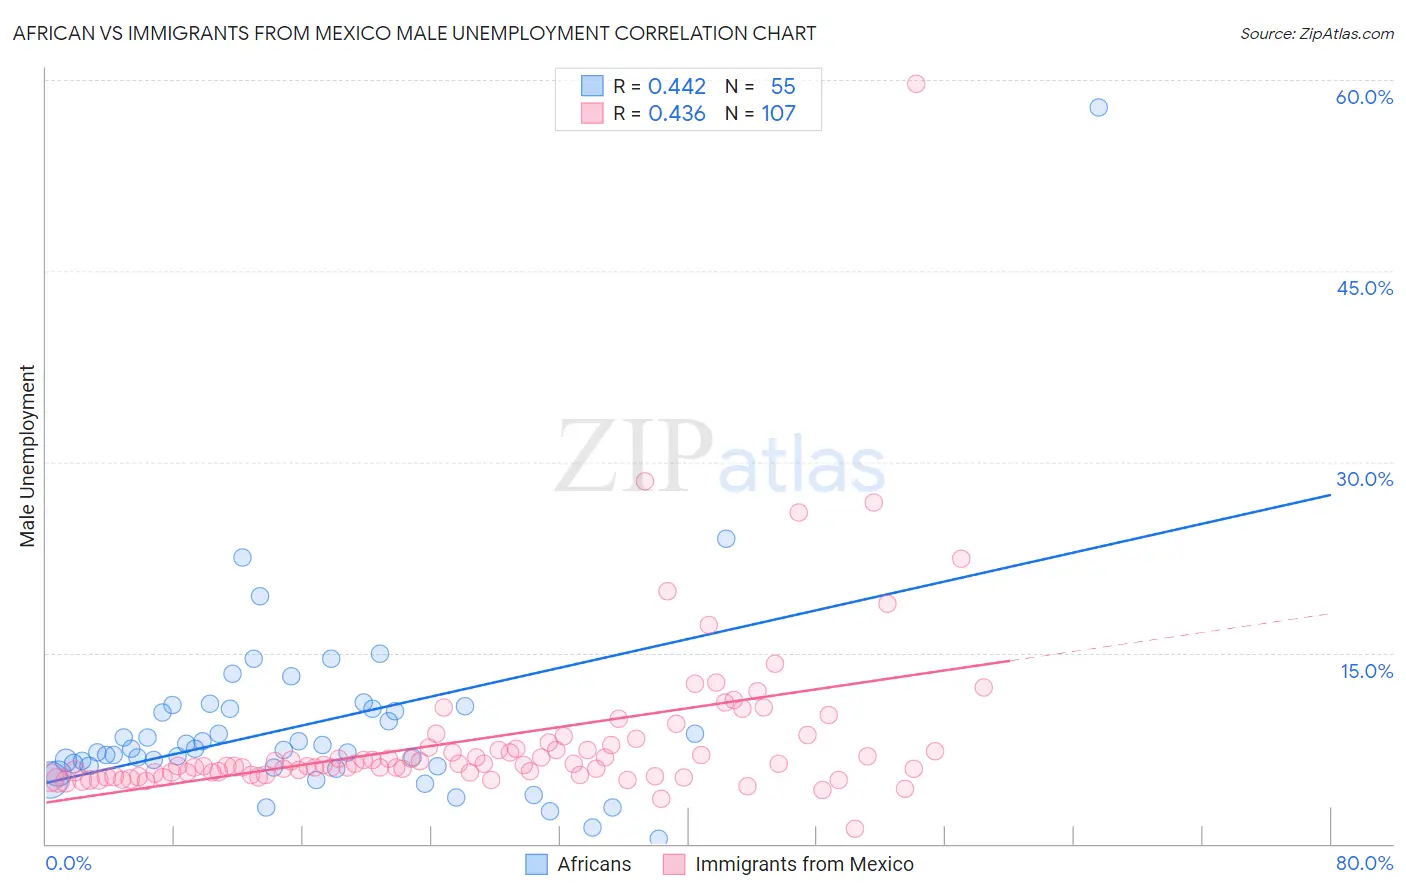
African vs Immigrants from Mexico Male Unemployment Correlation Chart
The statistical analysis conducted on geographies consisting of 467,193,011 people shows a moderate positive correlation between the proportion of Africans and unemployment rate among males in the United States with a correlation coefficient (R) of 0.442 and weighted average of 6.3%. Similarly, the statistical analysis conducted on geographies consisting of 508,075,361 people shows a moderate positive correlation between the proportion of Immigrants from Mexico and unemployment rate among males in the United States with a correlation coefficient (R) of 0.436 and weighted average of 5.9%, a difference of 6.3%.
Male Unemployment Correlation Summary
| Measurement | African | Immigrants from Mexico |
| Minimum | 0.40% | 1.2% |
| Maximum | 57.8% | 59.7% |
| Range | 57.4% | 58.5% |
| Mean | 9.3% | 8.3% |
| Median | 7.5% | 6.2% |
| Interquartile 25% (IQ1) | 6.1% | 5.4% |
| Interquartile 75% (IQ3) | 10.6% | 7.8% |
| Interquartile Range (IQR) | 4.5% | 2.4% |
| Standard Deviation (Sample) | 8.1% | 6.8% |
| Standard Deviation (Population) | 8.0% | 6.8% |
Similar Demographics by Male Unemployment
Demographics Similar to Africans by Male Unemployment
In terms of male unemployment, the demographic groups most similar to Africans are Central American Indian (6.3%, a difference of 0.29%), Immigrants from Senegal (6.3%, a difference of 0.33%), Immigrants from Ecuador (6.2%, a difference of 0.43%), Spanish American Indian (6.2%, a difference of 0.45%), and Immigrants from Caribbean (6.3%, a difference of 0.45%).
| Demographics | Rating | Rank | Male Unemployment |
| Ghanaians | 0.0 /100 | #279 | Tragic 6.1% |
| Immigrants | Ghana | 0.0 /100 | #280 | Tragic 6.2% |
| Sierra Leoneans | 0.0 /100 | #281 | Tragic 6.2% |
| Ecuadorians | 0.0 /100 | #282 | Tragic 6.2% |
| Immigrants | Western Africa | 0.0 /100 | #283 | Tragic 6.2% |
| Spanish American Indians | 0.0 /100 | #284 | Tragic 6.2% |
| Immigrants | Ecuador | 0.0 /100 | #285 | Tragic 6.2% |
| Africans | 0.0 /100 | #286 | Tragic 6.3% |
| Central American Indians | 0.0 /100 | #287 | Tragic 6.3% |
| Immigrants | Senegal | 0.0 /100 | #288 | Tragic 6.3% |
| Immigrants | Caribbean | 0.0 /100 | #289 | Tragic 6.3% |
| U.S. Virgin Islanders | 0.0 /100 | #290 | Tragic 6.4% |
| Immigrants | Azores | 0.0 /100 | #291 | Tragic 6.4% |
| Nepalese | 0.0 /100 | #292 | Tragic 6.4% |
| Haitians | 0.0 /100 | #293 | Tragic 6.4% |
Demographics Similar to Immigrants from Mexico by Male Unemployment
In terms of male unemployment, the demographic groups most similar to Immigrants from Mexico are Immigrants from Latin America (5.9%, a difference of 0.22%), French American Indian (5.9%, a difference of 0.39%), Immigrants from Portugal (5.9%, a difference of 0.46%), Bahamian (5.9%, a difference of 0.52%), and Nigerian (5.9%, a difference of 0.65%).
| Demographics | Rating | Rank | Male Unemployment |
| Hispanics or Latinos | 0.1 /100 | #257 | Tragic 5.8% |
| Dutch West Indians | 0.1 /100 | #258 | Tragic 5.8% |
| Cajuns | 0.1 /100 | #259 | Tragic 5.8% |
| Immigrants | Central America | 0.1 /100 | #260 | Tragic 5.8% |
| Liberians | 0.1 /100 | #261 | Tragic 5.8% |
| Immigrants | Portugal | 0.1 /100 | #262 | Tragic 5.9% |
| Immigrants | Latin America | 0.1 /100 | #263 | Tragic 5.9% |
| Immigrants | Mexico | 0.0 /100 | #264 | Tragic 5.9% |
| French American Indians | 0.0 /100 | #265 | Tragic 5.9% |
| Bahamians | 0.0 /100 | #266 | Tragic 5.9% |
| Nigerians | 0.0 /100 | #267 | Tragic 5.9% |
| Bermudans | 0.0 /100 | #268 | Tragic 5.9% |
| Immigrants | Nigeria | 0.0 /100 | #269 | Tragic 6.0% |
| Sub-Saharan Africans | 0.0 /100 | #270 | Tragic 6.0% |
| Blackfeet | 0.0 /100 | #271 | Tragic 6.0% |