Yugoslavian vs Immigrants from Hong Kong Male Unemployment
COMPARE
Yugoslavian
Immigrants from Hong Kong
Male Unemployment
Male Unemployment Comparison
Yugoslavians
Immigrants from Hong Kong
5.0%
MALE UNEMPLOYMENT
98.7/ 100
METRIC RATING
54th/ 347
METRIC RANK
5.2%
MALE UNEMPLOYMENT
65.7/ 100
METRIC RATING
163rd/ 347
METRIC RANK
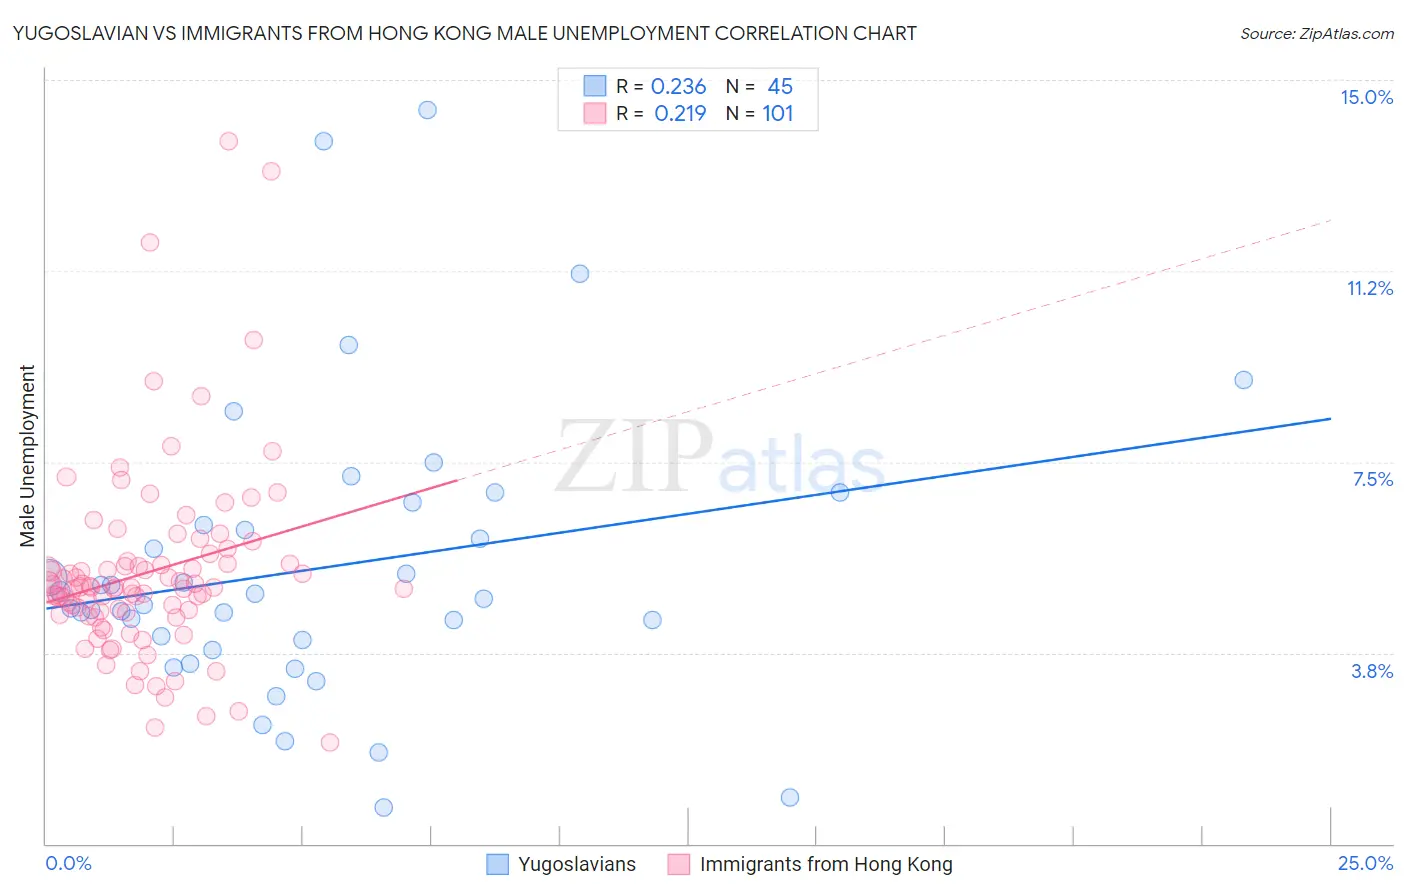
Yugoslavian vs Immigrants from Hong Kong Male Unemployment Correlation Chart
The statistical analysis conducted on geographies consisting of 284,881,859 people shows a weak positive correlation between the proportion of Yugoslavians and unemployment rate among males in the United States with a correlation coefficient (R) of 0.236 and weighted average of 5.0%. Similarly, the statistical analysis conducted on geographies consisting of 253,631,392 people shows a weak positive correlation between the proportion of Immigrants from Hong Kong and unemployment rate among males in the United States with a correlation coefficient (R) of 0.219 and weighted average of 5.2%, a difference of 5.7%.
Male Unemployment Correlation Summary
| Measurement | Yugoslavian | Immigrants from Hong Kong |
| Minimum | 0.70% | 2.0% |
| Maximum | 14.4% | 13.8% |
| Range | 13.7% | 11.8% |
| Mean | 5.4% | 5.3% |
| Median | 4.8% | 5.0% |
| Interquartile 25% (IQ1) | 3.9% | 4.5% |
| Interquartile 75% (IQ3) | 6.5% | 5.5% |
| Interquartile Range (IQR) | 2.6% | 0.99% |
| Standard Deviation (Sample) | 2.8% | 1.9% |
| Standard Deviation (Population) | 2.8% | 1.9% |
Similar Demographics by Male Unemployment
Demographics Similar to Yugoslavians by Male Unemployment
In terms of male unemployment, the demographic groups most similar to Yugoslavians are Czechoslovakian (5.0%, a difference of 0.0%), Immigrants from Bulgaria (5.0%, a difference of 0.010%), Jordanian (5.0%, a difference of 0.10%), Irish (5.0%, a difference of 0.16%), and Slovene (5.0%, a difference of 0.18%).
| Demographics | Rating | Rank | Male Unemployment |
| Austrians | 98.9 /100 | #47 | Exceptional 4.9% |
| Immigrants | Scotland | 98.9 /100 | #48 | Exceptional 4.9% |
| Poles | 98.9 /100 | #49 | Exceptional 4.9% |
| Croatians | 98.9 /100 | #50 | Exceptional 4.9% |
| Slovenes | 98.8 /100 | #51 | Exceptional 5.0% |
| Irish | 98.8 /100 | #52 | Exceptional 5.0% |
| Jordanians | 98.8 /100 | #53 | Exceptional 5.0% |
| Yugoslavians | 98.7 /100 | #54 | Exceptional 5.0% |
| Czechoslovakians | 98.7 /100 | #55 | Exceptional 5.0% |
| Immigrants | Bulgaria | 98.7 /100 | #56 | Exceptional 5.0% |
| Turks | 98.5 /100 | #57 | Exceptional 5.0% |
| Lithuanians | 98.5 /100 | #58 | Exceptional 5.0% |
| Immigrants | Netherlands | 98.3 /100 | #59 | Exceptional 5.0% |
| Immigrants | Argentina | 98.1 /100 | #60 | Exceptional 5.0% |
| Cambodians | 98.1 /100 | #61 | Exceptional 5.0% |
Demographics Similar to Immigrants from Hong Kong by Male Unemployment
In terms of male unemployment, the demographic groups most similar to Immigrants from Hong Kong are Immigrants from Egypt (5.2%, a difference of 0.010%), Afghan (5.3%, a difference of 0.24%), South American (5.3%, a difference of 0.32%), Immigrants from China (5.2%, a difference of 0.34%), and Immigrants from Morocco (5.3%, a difference of 0.35%).
| Demographics | Rating | Rank | Male Unemployment |
| Americans | 72.7 /100 | #156 | Good 5.2% |
| Immigrants | Northern Africa | 72.3 /100 | #157 | Good 5.2% |
| Immigrants | Indonesia | 71.5 /100 | #158 | Good 5.2% |
| Indonesians | 71.2 /100 | #159 | Good 5.2% |
| Immigrants | Norway | 71.0 /100 | #160 | Good 5.2% |
| Immigrants | China | 70.6 /100 | #161 | Good 5.2% |
| Immigrants | Egypt | 65.9 /100 | #162 | Good 5.2% |
| Immigrants | Hong Kong | 65.7 /100 | #163 | Good 5.2% |
| Afghans | 62.0 /100 | #164 | Good 5.3% |
| South Americans | 60.6 /100 | #165 | Good 5.3% |
| Immigrants | Morocco | 60.2 /100 | #166 | Good 5.3% |
| Immigrants | Vietnam | 58.1 /100 | #167 | Average 5.3% |
| Immigrants | Ireland | 57.7 /100 | #168 | Average 5.3% |
| Immigrants | Congo | 57.4 /100 | #169 | Average 5.3% |
| Immigrants | Eastern Europe | 54.1 /100 | #170 | Average 5.3% |