Kenyan vs Immigrants from Hong Kong Male Unemployment
COMPARE
Kenyan
Immigrants from Hong Kong
Male Unemployment
Male Unemployment Comparison
Kenyans
Immigrants from Hong Kong
5.2%
MALE UNEMPLOYMENT
79.4/ 100
METRIC RATING
139th/ 347
METRIC RANK
5.2%
MALE UNEMPLOYMENT
65.7/ 100
METRIC RATING
163rd/ 347
METRIC RANK
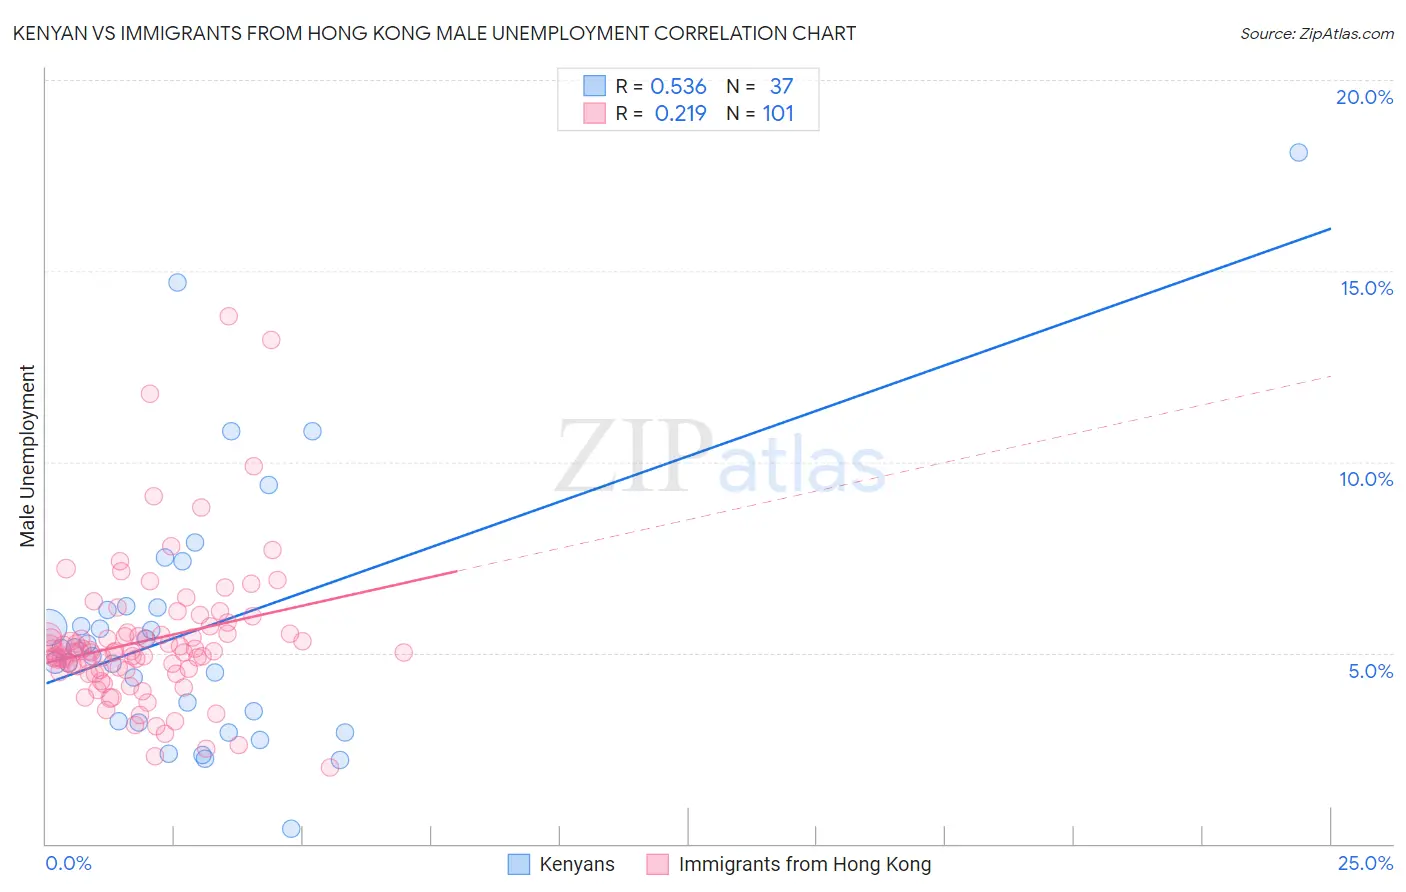
Kenyan vs Immigrants from Hong Kong Male Unemployment Correlation Chart
The statistical analysis conducted on geographies consisting of 168,001,564 people shows a substantial positive correlation between the proportion of Kenyans and unemployment rate among males in the United States with a correlation coefficient (R) of 0.536 and weighted average of 5.2%. Similarly, the statistical analysis conducted on geographies consisting of 253,631,392 people shows a weak positive correlation between the proportion of Immigrants from Hong Kong and unemployment rate among males in the United States with a correlation coefficient (R) of 0.219 and weighted average of 5.2%, a difference of 1.0%.
Male Unemployment Correlation Summary
| Measurement | Kenyan | Immigrants from Hong Kong |
| Minimum | 0.40% | 2.0% |
| Maximum | 18.1% | 13.8% |
| Range | 17.7% | 11.8% |
| Mean | 5.6% | 5.3% |
| Median | 5.1% | 5.0% |
| Interquartile 25% (IQ1) | 3.2% | 4.5% |
| Interquartile 75% (IQ3) | 6.2% | 5.5% |
| Interquartile Range (IQR) | 3.0% | 0.99% |
| Standard Deviation (Sample) | 3.5% | 1.9% |
| Standard Deviation (Population) | 3.5% | 1.9% |
Similar Demographics by Male Unemployment
Demographics Similar to Kenyans by Male Unemployment
In terms of male unemployment, the demographic groups most similar to Kenyans are Brazilian (5.2%, a difference of 0.010%), Immigrants from Croatia (5.2%, a difference of 0.020%), Immigrants from Switzerland (5.2%, a difference of 0.020%), Immigrants from Eastern Africa (5.2%, a difference of 0.030%), and Lebanese (5.2%, a difference of 0.040%).
| Demographics | Rating | Rank | Male Unemployment |
| Chickasaw | 82.9 /100 | #132 | Excellent 5.2% |
| Colombians | 81.1 /100 | #133 | Excellent 5.2% |
| Pakistanis | 80.5 /100 | #134 | Excellent 5.2% |
| Immigrants | Saudi Arabia | 80.1 /100 | #135 | Excellent 5.2% |
| Lebanese | 79.9 /100 | #136 | Good 5.2% |
| Immigrants | Eastern Africa | 79.8 /100 | #137 | Good 5.2% |
| Immigrants | Croatia | 79.7 /100 | #138 | Good 5.2% |
| Kenyans | 79.4 /100 | #139 | Good 5.2% |
| Brazilians | 79.3 /100 | #140 | Good 5.2% |
| Immigrants | Switzerland | 79.2 /100 | #141 | Good 5.2% |
| Fijians | 78.3 /100 | #142 | Good 5.2% |
| Syrians | 78.0 /100 | #143 | Good 5.2% |
| Sri Lankans | 77.9 /100 | #144 | Good 5.2% |
| Macedonians | 77.7 /100 | #145 | Good 5.2% |
| Immigrants | Kenya | 77.6 /100 | #146 | Good 5.2% |
Demographics Similar to Immigrants from Hong Kong by Male Unemployment
In terms of male unemployment, the demographic groups most similar to Immigrants from Hong Kong are Immigrants from Egypt (5.2%, a difference of 0.010%), Afghan (5.3%, a difference of 0.24%), South American (5.3%, a difference of 0.32%), Immigrants from China (5.2%, a difference of 0.34%), and Immigrants from Morocco (5.3%, a difference of 0.35%).
| Demographics | Rating | Rank | Male Unemployment |
| Americans | 72.7 /100 | #156 | Good 5.2% |
| Immigrants | Northern Africa | 72.3 /100 | #157 | Good 5.2% |
| Immigrants | Indonesia | 71.5 /100 | #158 | Good 5.2% |
| Indonesians | 71.2 /100 | #159 | Good 5.2% |
| Immigrants | Norway | 71.0 /100 | #160 | Good 5.2% |
| Immigrants | China | 70.6 /100 | #161 | Good 5.2% |
| Immigrants | Egypt | 65.9 /100 | #162 | Good 5.2% |
| Immigrants | Hong Kong | 65.7 /100 | #163 | Good 5.2% |
| Afghans | 62.0 /100 | #164 | Good 5.3% |
| South Americans | 60.6 /100 | #165 | Good 5.3% |
| Immigrants | Morocco | 60.2 /100 | #166 | Good 5.3% |
| Immigrants | Vietnam | 58.1 /100 | #167 | Average 5.3% |
| Immigrants | Ireland | 57.7 /100 | #168 | Average 5.3% |
| Immigrants | Congo | 57.4 /100 | #169 | Average 5.3% |
| Immigrants | Eastern Europe | 54.1 /100 | #170 | Average 5.3% |