Zimbabwean vs Immigrants from Hong Kong Male Unemployment
COMPARE
Zimbabwean
Immigrants from Hong Kong
Male Unemployment
Male Unemployment Comparison
Zimbabweans
Immigrants from Hong Kong
4.8%
MALE UNEMPLOYMENT
99.9/ 100
METRIC RATING
25th/ 347
METRIC RANK
5.2%
MALE UNEMPLOYMENT
65.7/ 100
METRIC RATING
163rd/ 347
METRIC RANK
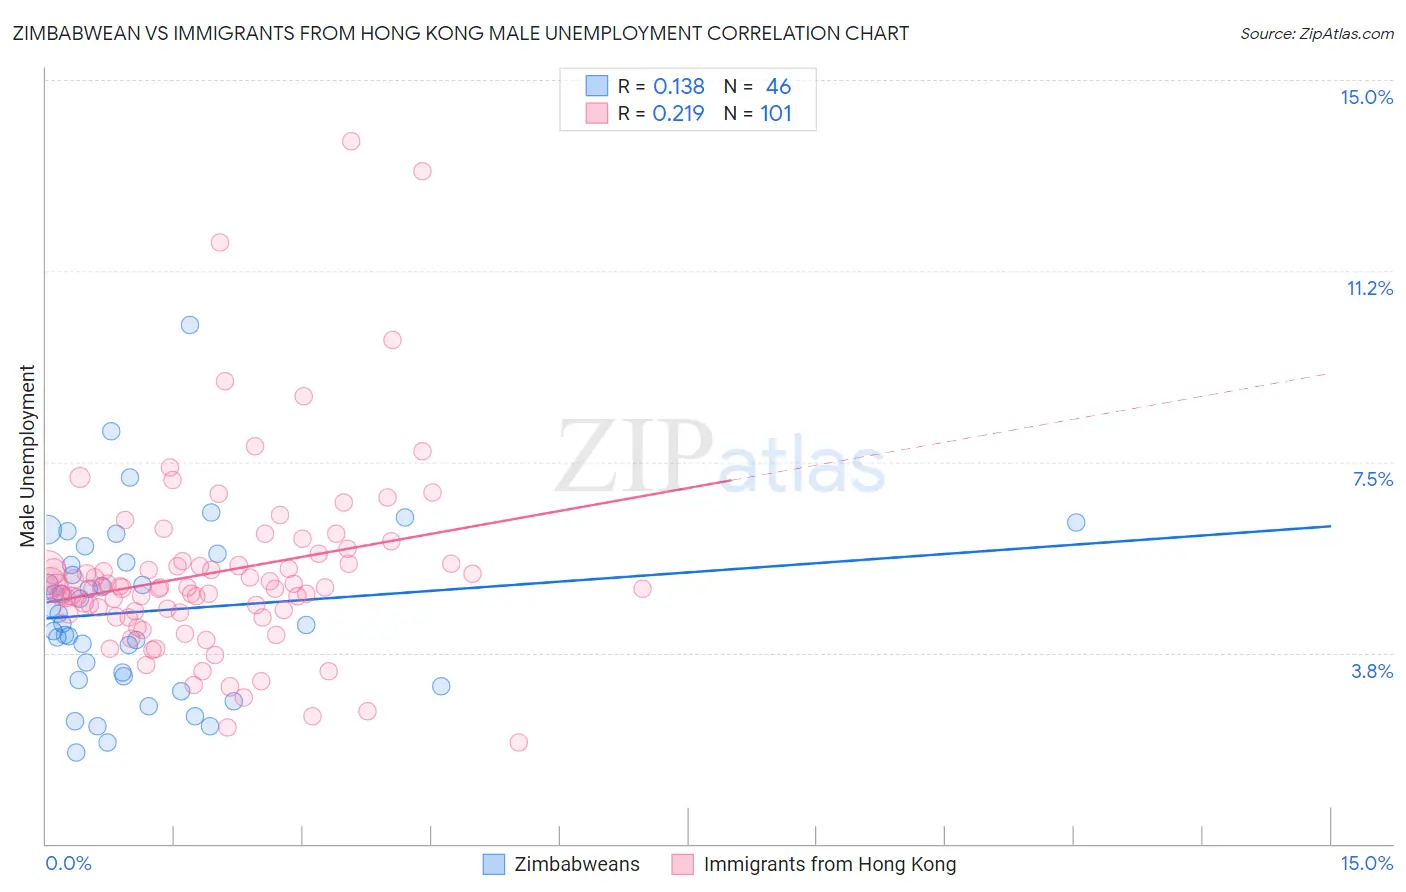
Zimbabwean vs Immigrants from Hong Kong Male Unemployment Correlation Chart
The statistical analysis conducted on geographies consisting of 69,161,381 people shows a poor positive correlation between the proportion of Zimbabweans and unemployment rate among males in the United States with a correlation coefficient (R) of 0.138 and weighted average of 4.8%. Similarly, the statistical analysis conducted on geographies consisting of 253,631,392 people shows a weak positive correlation between the proportion of Immigrants from Hong Kong and unemployment rate among males in the United States with a correlation coefficient (R) of 0.219 and weighted average of 5.2%, a difference of 9.8%.
Male Unemployment Correlation Summary
| Measurement | Zimbabwean | Immigrants from Hong Kong |
| Minimum | 1.8% | 2.0% |
| Maximum | 10.2% | 13.8% |
| Range | 8.4% | 11.8% |
| Mean | 4.6% | 5.3% |
| Median | 4.4% | 5.0% |
| Interquartile 25% (IQ1) | 3.3% | 4.5% |
| Interquartile 75% (IQ3) | 5.5% | 5.5% |
| Interquartile Range (IQR) | 2.2% | 0.99% |
| Standard Deviation (Sample) | 1.7% | 1.9% |
| Standard Deviation (Population) | 1.7% | 1.9% |
Similar Demographics by Male Unemployment
Demographics Similar to Zimbabweans by Male Unemployment
In terms of male unemployment, the demographic groups most similar to Zimbabweans are Dutch (4.8%, a difference of 0.020%), Immigrants from South Central Asia (4.8%, a difference of 0.10%), Tongan (4.8%, a difference of 0.13%), Carpatho Rusyn (4.8%, a difference of 0.18%), and Immigrants from Taiwan (4.8%, a difference of 0.19%).
| Demographics | Rating | Rank | Male Unemployment |
| English | 99.9 /100 | #18 | Exceptional 4.8% |
| Europeans | 99.9 /100 | #19 | Exceptional 4.8% |
| Pennsylvania Germans | 99.9 /100 | #20 | Exceptional 4.8% |
| Immigrants | Taiwan | 99.9 /100 | #21 | Exceptional 4.8% |
| Carpatho Rusyns | 99.9 /100 | #22 | Exceptional 4.8% |
| Tongans | 99.9 /100 | #23 | Exceptional 4.8% |
| Immigrants | South Central Asia | 99.9 /100 | #24 | Exceptional 4.8% |
| Zimbabweans | 99.9 /100 | #25 | Exceptional 4.8% |
| Dutch | 99.9 /100 | #26 | Exceptional 4.8% |
| Belgians | 99.9 /100 | #27 | Exceptional 4.8% |
| Bulgarians | 99.8 /100 | #28 | Exceptional 4.8% |
| Scottish | 99.8 /100 | #29 | Exceptional 4.8% |
| British | 99.8 /100 | #30 | Exceptional 4.8% |
| Sudanese | 99.8 /100 | #31 | Exceptional 4.8% |
| Immigrants | Nepal | 99.8 /100 | #32 | Exceptional 4.8% |
Demographics Similar to Immigrants from Hong Kong by Male Unemployment
In terms of male unemployment, the demographic groups most similar to Immigrants from Hong Kong are Immigrants from Egypt (5.2%, a difference of 0.010%), Afghan (5.3%, a difference of 0.24%), South American (5.3%, a difference of 0.32%), Immigrants from China (5.2%, a difference of 0.34%), and Immigrants from Morocco (5.3%, a difference of 0.35%).
| Demographics | Rating | Rank | Male Unemployment |
| Americans | 72.7 /100 | #156 | Good 5.2% |
| Immigrants | Northern Africa | 72.3 /100 | #157 | Good 5.2% |
| Immigrants | Indonesia | 71.5 /100 | #158 | Good 5.2% |
| Indonesians | 71.2 /100 | #159 | Good 5.2% |
| Immigrants | Norway | 71.0 /100 | #160 | Good 5.2% |
| Immigrants | China | 70.6 /100 | #161 | Good 5.2% |
| Immigrants | Egypt | 65.9 /100 | #162 | Good 5.2% |
| Immigrants | Hong Kong | 65.7 /100 | #163 | Good 5.2% |
| Afghans | 62.0 /100 | #164 | Good 5.3% |
| South Americans | 60.6 /100 | #165 | Good 5.3% |
| Immigrants | Morocco | 60.2 /100 | #166 | Good 5.3% |
| Immigrants | Vietnam | 58.1 /100 | #167 | Average 5.3% |
| Immigrants | Ireland | 57.7 /100 | #168 | Average 5.3% |
| Immigrants | Congo | 57.4 /100 | #169 | Average 5.3% |
| Immigrants | Eastern Europe | 54.1 /100 | #170 | Average 5.3% |