African vs Bermudan Unemployment
COMPARE
African
Bermudan
Unemployment
Unemployment Comparison
Africans
Bermudans
6.1%
UNEMPLOYMENT
0.0/ 100
METRIC RATING
281st/ 347
METRIC RANK
5.6%
UNEMPLOYMENT
1.1/ 100
METRIC RATING
246th/ 347
METRIC RANK
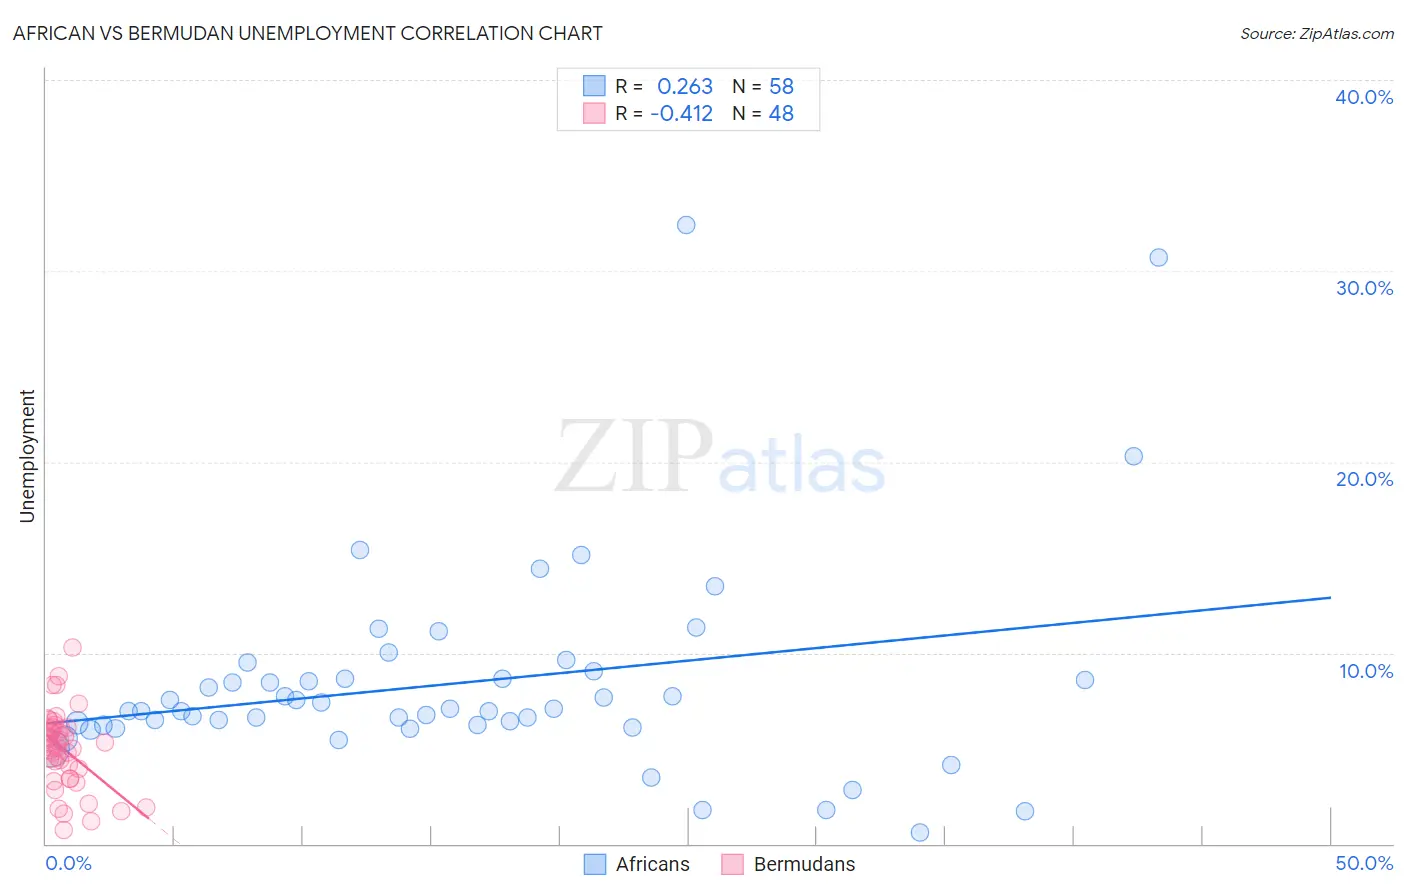
African vs Bermudan Unemployment Correlation Chart
The statistical analysis conducted on geographies consisting of 469,312,899 people shows a weak positive correlation between the proportion of Africans and unemployment in the United States with a correlation coefficient (R) of 0.263 and weighted average of 6.1%. Similarly, the statistical analysis conducted on geographies consisting of 55,703,293 people shows a moderate negative correlation between the proportion of Bermudans and unemployment in the United States with a correlation coefficient (R) of -0.412 and weighted average of 5.6%, a difference of 7.8%.
Unemployment Correlation Summary
| Measurement | African | Bermudan |
| Minimum | 0.60% | 0.70% |
| Maximum | 32.4% | 10.3% |
| Range | 31.8% | 9.6% |
| Mean | 8.4% | 4.9% |
| Median | 7.0% | 5.1% |
| Interquartile 25% (IQ1) | 6.2% | 3.6% |
| Interquartile 75% (IQ3) | 8.6% | 6.1% |
| Interquartile Range (IQR) | 2.4% | 2.4% |
| Standard Deviation (Sample) | 5.6% | 2.0% |
| Standard Deviation (Population) | 5.5% | 2.0% |
Similar Demographics by Unemployment
Demographics Similar to Africans by Unemployment
In terms of unemployment, the demographic groups most similar to Africans are Immigrants from the Azores (6.1%, a difference of 0.060%), Immigrants from Ghana (6.1%, a difference of 0.15%), Aleut (6.1%, a difference of 0.28%), Immigrants from Mexico (6.0%, a difference of 0.58%), and Immigrants from Western Africa (6.0%, a difference of 0.58%).
| Demographics | Rating | Rank | Unemployment |
| Bahamians | 0.0 /100 | #274 | Tragic 5.9% |
| Immigrants | Latin America | 0.0 /100 | #275 | Tragic 5.9% |
| Immigrants | Central America | 0.0 /100 | #276 | Tragic 6.0% |
| Armenians | 0.0 /100 | #277 | Tragic 6.0% |
| Ghanaians | 0.0 /100 | #278 | Tragic 6.0% |
| Immigrants | Mexico | 0.0 /100 | #279 | Tragic 6.0% |
| Immigrants | Western Africa | 0.0 /100 | #280 | Tragic 6.0% |
| Africans | 0.0 /100 | #281 | Tragic 6.1% |
| Immigrants | Azores | 0.0 /100 | #282 | Tragic 6.1% |
| Immigrants | Ghana | 0.0 /100 | #283 | Tragic 6.1% |
| Aleuts | 0.0 /100 | #284 | Tragic 6.1% |
| Immigrants | Senegal | 0.0 /100 | #285 | Tragic 6.1% |
| Immigrants | Caribbean | 0.0 /100 | #286 | Tragic 6.2% |
| Nepalese | 0.0 /100 | #287 | Tragic 6.2% |
| Ecuadorians | 0.0 /100 | #288 | Tragic 6.2% |
Demographics Similar to Bermudans by Unemployment
In terms of unemployment, the demographic groups most similar to Bermudans are French American Indian (5.6%, a difference of 0.050%), Dutch West Indian (5.6%, a difference of 0.070%), Immigrants from Cameroon (5.6%, a difference of 0.15%), Marshallese (5.6%, a difference of 0.22%), and Liberian (5.6%, a difference of 0.28%).
| Demographics | Rating | Rank | Unemployment |
| Immigrants | Immigrants | 2.6 /100 | #239 | Tragic 5.5% |
| Cree | 2.6 /100 | #240 | Tragic 5.6% |
| Tlingit-Haida | 2.0 /100 | #241 | Tragic 5.6% |
| Spanish Americans | 2.0 /100 | #242 | Tragic 5.6% |
| Marshallese | 1.3 /100 | #243 | Tragic 5.6% |
| Dutch West Indians | 1.2 /100 | #244 | Tragic 5.6% |
| French American Indians | 1.2 /100 | #245 | Tragic 5.6% |
| Bermudans | 1.1 /100 | #246 | Tragic 5.6% |
| Immigrants | Cameroon | 1.0 /100 | #247 | Tragic 5.6% |
| Liberians | 0.9 /100 | #248 | Tragic 5.6% |
| Cajuns | 0.8 /100 | #249 | Tragic 5.6% |
| Japanese | 0.8 /100 | #250 | Tragic 5.6% |
| Kiowa | 0.6 /100 | #251 | Tragic 5.7% |
| Hondurans | 0.3 /100 | #252 | Tragic 5.7% |
| Central Americans | 0.3 /100 | #253 | Tragic 5.7% |