Yugoslavian vs Chickasaw Unemployment
COMPARE
Yugoslavian
Chickasaw
Unemployment
Unemployment Comparison
Yugoslavians
Chickasaw
4.8%
UNEMPLOYMENT
99.5/ 100
METRIC RATING
43rd/ 347
METRIC RANK
5.0%
UNEMPLOYMENT
94.0/ 100
METRIC RATING
103rd/ 347
METRIC RANK
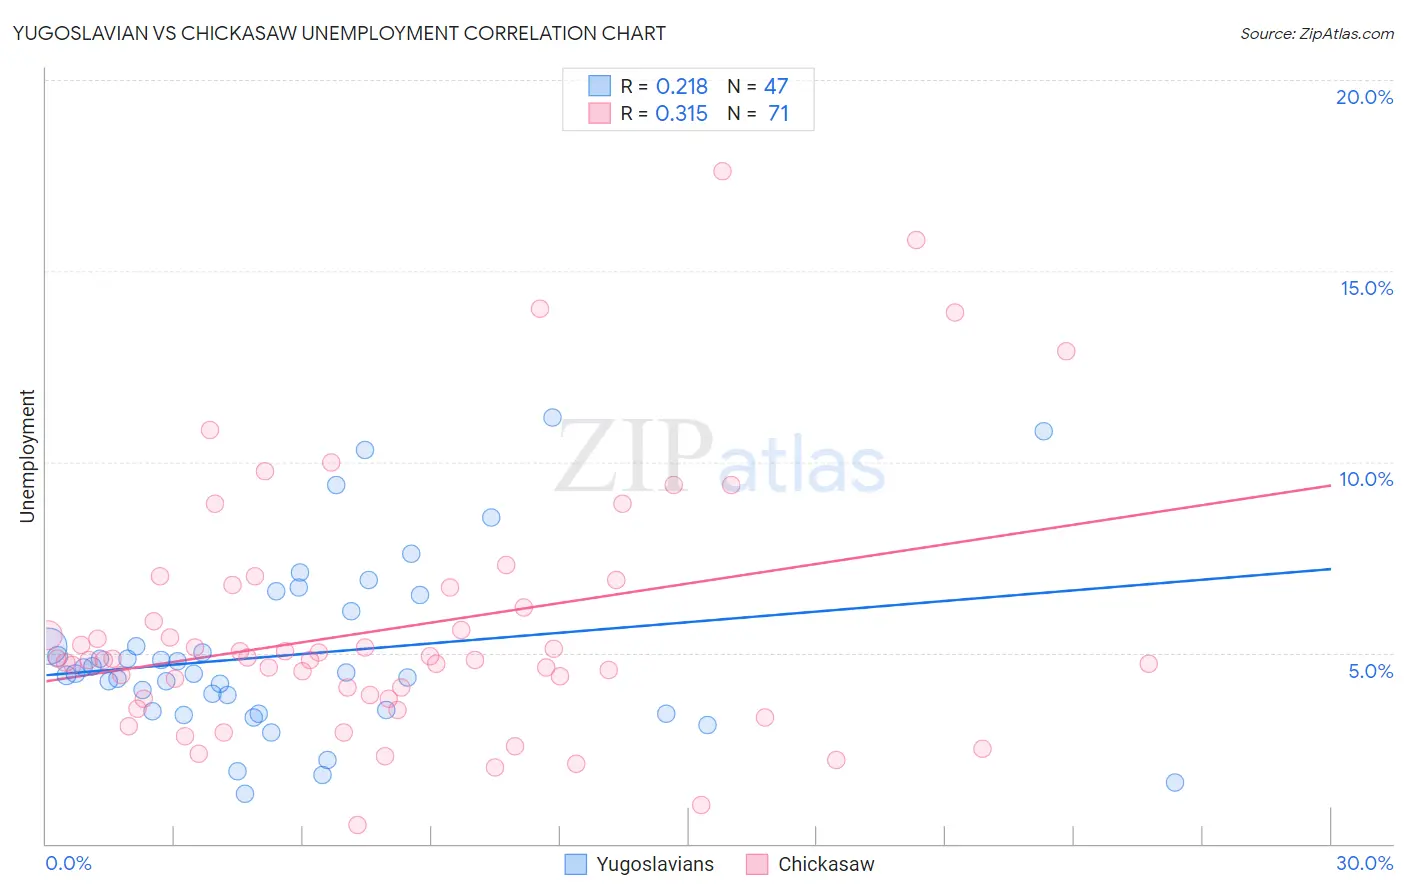
Yugoslavian vs Chickasaw Unemployment Correlation Chart
The statistical analysis conducted on geographies consisting of 285,527,553 people shows a weak positive correlation between the proportion of Yugoslavians and unemployment in the United States with a correlation coefficient (R) of 0.218 and weighted average of 4.8%. Similarly, the statistical analysis conducted on geographies consisting of 147,562,181 people shows a mild positive correlation between the proportion of Chickasaw and unemployment in the United States with a correlation coefficient (R) of 0.315 and weighted average of 5.0%, a difference of 4.2%.
Unemployment Correlation Summary
| Measurement | Yugoslavian | Chickasaw |
| Minimum | 1.3% | 0.50% |
| Maximum | 11.2% | 17.6% |
| Range | 9.8% | 17.1% |
| Mean | 5.0% | 5.6% |
| Median | 4.5% | 4.8% |
| Interquartile 25% (IQ1) | 3.5% | 3.8% |
| Interquartile 75% (IQ3) | 6.1% | 6.7% |
| Interquartile Range (IQR) | 2.6% | 2.9% |
| Standard Deviation (Sample) | 2.3% | 3.3% |
| Standard Deviation (Population) | 2.3% | 3.3% |
Similar Demographics by Unemployment
Demographics Similar to Yugoslavians by Unemployment
In terms of unemployment, the demographic groups most similar to Yugoslavians are Austrian (4.8%, a difference of 0.060%), French (4.8%, a difference of 0.11%), Filipino (4.8%, a difference of 0.20%), Immigrants from Nepal (4.8%, a difference of 0.28%), and Immigrants from Taiwan (4.8%, a difference of 0.30%).
| Demographics | Rating | Rank | Unemployment |
| Tongans | 99.7 /100 | #36 | Exceptional 4.8% |
| Czechoslovakians | 99.7 /100 | #37 | Exceptional 4.8% |
| Bolivians | 99.7 /100 | #38 | Exceptional 4.8% |
| Lithuanians | 99.7 /100 | #39 | Exceptional 4.8% |
| Northern Europeans | 99.7 /100 | #40 | Exceptional 4.8% |
| Immigrants | Bosnia and Herzegovina | 99.7 /100 | #41 | Exceptional 4.8% |
| Filipinos | 99.5 /100 | #42 | Exceptional 4.8% |
| Yugoslavians | 99.5 /100 | #43 | Exceptional 4.8% |
| Austrians | 99.5 /100 | #44 | Exceptional 4.8% |
| French | 99.5 /100 | #45 | Exceptional 4.8% |
| Immigrants | Nepal | 99.4 /100 | #46 | Exceptional 4.8% |
| Immigrants | Taiwan | 99.4 /100 | #47 | Exceptional 4.8% |
| Immigrants | Scotland | 99.3 /100 | #48 | Exceptional 4.9% |
| Immigrants | South Central Asia | 99.3 /100 | #49 | Exceptional 4.9% |
| French Canadians | 99.3 /100 | #50 | Exceptional 4.9% |
Demographics Similar to Chickasaw by Unemployment
In terms of unemployment, the demographic groups most similar to Chickasaw are Osage (5.0%, a difference of 0.0%), Maltese (5.0%, a difference of 0.0%), Immigrants from Argentina (5.0%, a difference of 0.040%), Immigrants from Romania (5.0%, a difference of 0.070%), and American (5.0%, a difference of 0.080%).
| Demographics | Rating | Rank | Unemployment |
| Immigrants | England | 95.2 /100 | #96 | Exceptional 5.0% |
| Immigrants | Czechoslovakia | 95.1 /100 | #97 | Exceptional 5.0% |
| Romanians | 95.0 /100 | #98 | Exceptional 5.0% |
| Mongolians | 94.8 /100 | #99 | Exceptional 5.0% |
| Estonians | 94.6 /100 | #100 | Exceptional 5.0% |
| Americans | 94.3 /100 | #101 | Exceptional 5.0% |
| Immigrants | Argentina | 94.1 /100 | #102 | Exceptional 5.0% |
| Chickasaw | 94.0 /100 | #103 | Exceptional 5.0% |
| Osage | 94.0 /100 | #104 | Exceptional 5.0% |
| Maltese | 94.0 /100 | #105 | Exceptional 5.0% |
| Immigrants | Romania | 93.7 /100 | #106 | Exceptional 5.0% |
| Immigrants | Turkey | 93.7 /100 | #107 | Exceptional 5.0% |
| Immigrants | Kuwait | 93.7 /100 | #108 | Exceptional 5.0% |
| Immigrants | Eritrea | 93.3 /100 | #109 | Exceptional 5.0% |
| Immigrants | Lithuania | 93.2 /100 | #110 | Exceptional 5.0% |