African vs West Indian Unemployment
COMPARE
African
West Indian
Unemployment
Unemployment Comparison
Africans
West Indians
6.1%
UNEMPLOYMENT
0.0/ 100
METRIC RATING
281st/ 347
METRIC RANK
6.4%
UNEMPLOYMENT
0.0/ 100
METRIC RATING
302nd/ 347
METRIC RANK
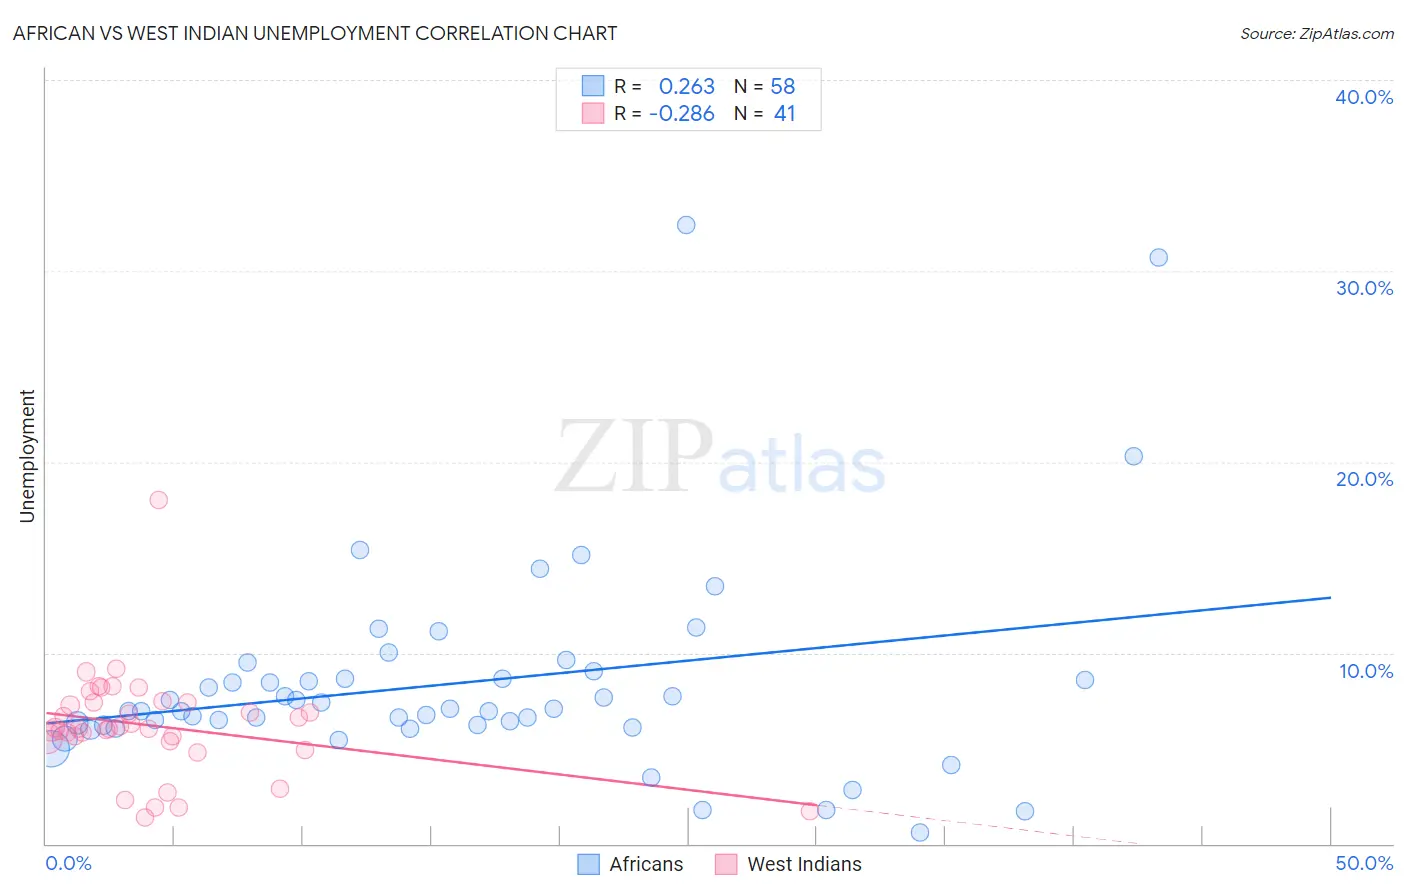
African vs West Indian Unemployment Correlation Chart
The statistical analysis conducted on geographies consisting of 469,312,899 people shows a weak positive correlation between the proportion of Africans and unemployment in the United States with a correlation coefficient (R) of 0.263 and weighted average of 6.1%. Similarly, the statistical analysis conducted on geographies consisting of 253,931,016 people shows a weak negative correlation between the proportion of West Indians and unemployment in the United States with a correlation coefficient (R) of -0.286 and weighted average of 6.4%, a difference of 5.1%.
Unemployment Correlation Summary
| Measurement | African | West Indian |
| Minimum | 0.60% | 1.4% |
| Maximum | 32.4% | 18.0% |
| Range | 31.8% | 16.6% |
| Mean | 8.4% | 6.2% |
| Median | 7.0% | 6.0% |
| Interquartile 25% (IQ1) | 6.2% | 5.5% |
| Interquartile 75% (IQ3) | 8.6% | 7.4% |
| Interquartile Range (IQR) | 2.4% | 1.9% |
| Standard Deviation (Sample) | 5.6% | 2.8% |
| Standard Deviation (Population) | 5.5% | 2.7% |
Similar Demographics by Unemployment
Demographics Similar to Africans by Unemployment
In terms of unemployment, the demographic groups most similar to Africans are Immigrants from the Azores (6.1%, a difference of 0.060%), Immigrants from Ghana (6.1%, a difference of 0.15%), Aleut (6.1%, a difference of 0.28%), Immigrants from Mexico (6.0%, a difference of 0.58%), and Immigrants from Western Africa (6.0%, a difference of 0.58%).
| Demographics | Rating | Rank | Unemployment |
| Bahamians | 0.0 /100 | #274 | Tragic 5.9% |
| Immigrants | Latin America | 0.0 /100 | #275 | Tragic 5.9% |
| Immigrants | Central America | 0.0 /100 | #276 | Tragic 6.0% |
| Armenians | 0.0 /100 | #277 | Tragic 6.0% |
| Ghanaians | 0.0 /100 | #278 | Tragic 6.0% |
| Immigrants | Mexico | 0.0 /100 | #279 | Tragic 6.0% |
| Immigrants | Western Africa | 0.0 /100 | #280 | Tragic 6.0% |
| Africans | 0.0 /100 | #281 | Tragic 6.1% |
| Immigrants | Azores | 0.0 /100 | #282 | Tragic 6.1% |
| Immigrants | Ghana | 0.0 /100 | #283 | Tragic 6.1% |
| Aleuts | 0.0 /100 | #284 | Tragic 6.1% |
| Immigrants | Senegal | 0.0 /100 | #285 | Tragic 6.1% |
| Immigrants | Caribbean | 0.0 /100 | #286 | Tragic 6.2% |
| Nepalese | 0.0 /100 | #287 | Tragic 6.2% |
| Ecuadorians | 0.0 /100 | #288 | Tragic 6.2% |
Demographics Similar to West Indians by Unemployment
In terms of unemployment, the demographic groups most similar to West Indians are Belizean (6.4%, a difference of 0.23%), Trinidadian and Tobagonian (6.3%, a difference of 0.25%), Immigrants from Trinidad and Tobago (6.3%, a difference of 0.74%), Immigrants from West Indies (6.3%, a difference of 0.86%), and Immigrants from Haiti (6.3%, a difference of 0.90%).
| Demographics | Rating | Rank | Unemployment |
| U.S. Virgin Islanders | 0.0 /100 | #295 | Tragic 6.3% |
| Ute | 0.0 /100 | #296 | Tragic 6.3% |
| Jamaicans | 0.0 /100 | #297 | Tragic 6.3% |
| Immigrants | Haiti | 0.0 /100 | #298 | Tragic 6.3% |
| Immigrants | West Indies | 0.0 /100 | #299 | Tragic 6.3% |
| Immigrants | Trinidad and Tobago | 0.0 /100 | #300 | Tragic 6.3% |
| Trinidadians and Tobagonians | 0.0 /100 | #301 | Tragic 6.3% |
| West Indians | 0.0 /100 | #302 | Tragic 6.4% |
| Belizeans | 0.0 /100 | #303 | Tragic 6.4% |
| Immigrants | Jamaica | 0.0 /100 | #304 | Tragic 6.4% |
| Menominee | 0.0 /100 | #305 | Tragic 6.4% |
| Lumbee | 0.0 /100 | #306 | Tragic 6.4% |
| Immigrants | Bangladesh | 0.0 /100 | #307 | Tragic 6.5% |
| Barbadians | 0.0 /100 | #308 | Tragic 6.5% |
| Vietnamese | 0.0 /100 | #309 | Tragic 6.5% |