Immigrants from Grenada vs Osage Male Poverty
COMPARE
Immigrants from Grenada
Osage
Male Poverty
Male Poverty Comparison
Immigrants from Grenada
Osage
14.7%
MALE POVERTY
0.0/ 100
METRIC RATING
318th/ 347
METRIC RANK
12.3%
MALE POVERTY
1.5/ 100
METRIC RATING
225th/ 347
METRIC RANK
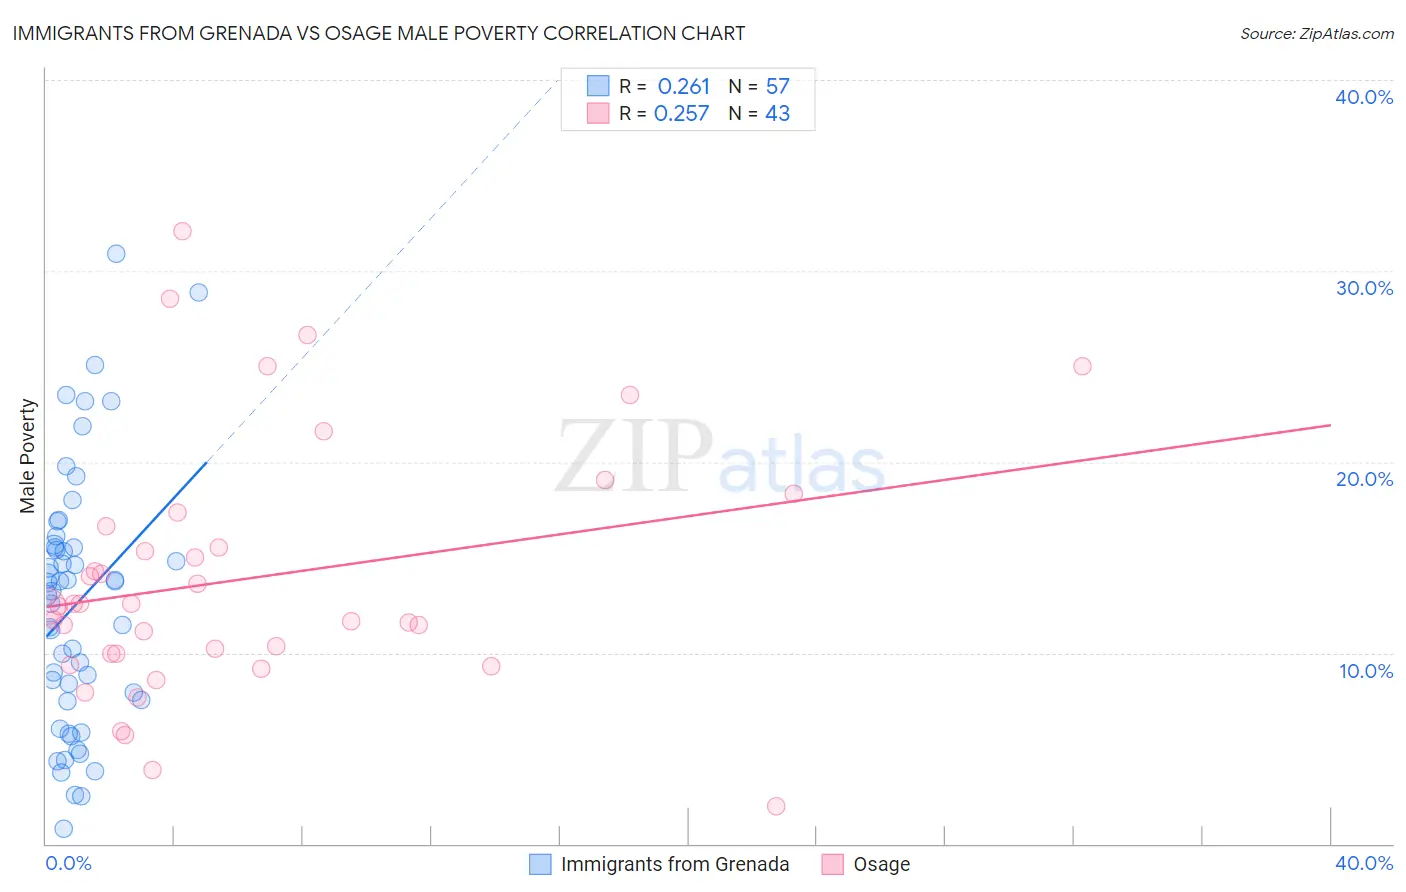
Immigrants from Grenada vs Osage Male Poverty Correlation Chart
The statistical analysis conducted on geographies consisting of 67,181,242 people shows a weak positive correlation between the proportion of Immigrants from Grenada and poverty level among males in the United States with a correlation coefficient (R) of 0.261 and weighted average of 14.7%. Similarly, the statistical analysis conducted on geographies consisting of 91,789,808 people shows a weak positive correlation between the proportion of Osage and poverty level among males in the United States with a correlation coefficient (R) of 0.257 and weighted average of 12.3%, a difference of 19.3%.
Male Poverty Correlation Summary
| Measurement | Immigrants from Grenada | Osage |
| Minimum | 0.80% | 1.9% |
| Maximum | 30.9% | 32.1% |
| Range | 30.1% | 30.2% |
| Mean | 12.6% | 13.9% |
| Median | 13.2% | 12.4% |
| Interquartile 25% (IQ1) | 7.5% | 9.9% |
| Interquartile 75% (IQ3) | 15.6% | 16.6% |
| Interquartile Range (IQR) | 8.1% | 6.7% |
| Standard Deviation (Sample) | 6.7% | 6.6% |
| Standard Deviation (Population) | 6.7% | 6.5% |
Similar Demographics by Male Poverty
Demographics Similar to Immigrants from Grenada by Male Poverty
In terms of male poverty, the demographic groups most similar to Immigrants from Grenada are U.S. Virgin Islander (14.7%, a difference of 0.030%), Immigrants from Dominica (14.7%, a difference of 0.060%), Immigrants from Congo (14.7%, a difference of 0.12%), British West Indian (14.6%, a difference of 0.74%), and Chippewa (14.6%, a difference of 0.76%).
| Demographics | Rating | Rank | Male Poverty |
| Hondurans | 0.0 /100 | #311 | Tragic 14.3% |
| Choctaw | 0.0 /100 | #312 | Tragic 14.4% |
| Immigrants | Somalia | 0.0 /100 | #313 | Tragic 14.6% |
| Immigrants | Honduras | 0.0 /100 | #314 | Tragic 14.6% |
| Chippewa | 0.0 /100 | #315 | Tragic 14.6% |
| British West Indians | 0.0 /100 | #316 | Tragic 14.6% |
| Immigrants | Dominica | 0.0 /100 | #317 | Tragic 14.7% |
| Immigrants | Grenada | 0.0 /100 | #318 | Tragic 14.7% |
| U.S. Virgin Islanders | 0.0 /100 | #319 | Tragic 14.7% |
| Immigrants | Congo | 0.0 /100 | #320 | Tragic 14.7% |
| Arapaho | 0.0 /100 | #321 | Tragic 15.1% |
| Kiowa | 0.0 /100 | #322 | Tragic 15.2% |
| Colville | 0.0 /100 | #323 | Tragic 15.2% |
| Menominee | 0.0 /100 | #324 | Tragic 15.3% |
| Yakama | 0.0 /100 | #325 | Tragic 15.3% |
Demographics Similar to Osage by Male Poverty
In terms of male poverty, the demographic groups most similar to Osage are Immigrants from Nigeria (12.3%, a difference of 0.060%), Nigerian (12.3%, a difference of 0.17%), Alaska Native (12.4%, a difference of 0.26%), Alsatian (12.4%, a difference of 0.30%), and Cuban (12.4%, a difference of 0.39%).
| Demographics | Rating | Rank | Male Poverty |
| German Russians | 2.5 /100 | #218 | Tragic 12.2% |
| Bermudans | 2.4 /100 | #219 | Tragic 12.2% |
| Immigrants | Eritrea | 2.4 /100 | #220 | Tragic 12.2% |
| Ugandans | 2.2 /100 | #221 | Tragic 12.2% |
| Immigrants | Africa | 2.1 /100 | #222 | Tragic 12.2% |
| Immigrants | Micronesia | 2.1 /100 | #223 | Tragic 12.2% |
| Immigrants | Nigeria | 1.6 /100 | #224 | Tragic 12.3% |
| Osage | 1.5 /100 | #225 | Tragic 12.3% |
| Nigerians | 1.4 /100 | #226 | Tragic 12.3% |
| Alaska Natives | 1.4 /100 | #227 | Tragic 12.4% |
| Alsatians | 1.3 /100 | #228 | Tragic 12.4% |
| Cubans | 1.3 /100 | #229 | Tragic 12.4% |
| Marshallese | 0.8 /100 | #230 | Tragic 12.5% |
| Salvadorans | 0.6 /100 | #231 | Tragic 12.6% |
| Nicaraguans | 0.6 /100 | #232 | Tragic 12.6% |