Zimbabwean vs Osage No Schooling Completed
COMPARE
Zimbabwean
Osage
No Schooling Completed
No Schooling Completed Comparison
Zimbabweans
Osage
1.7%
NO SCHOOLING COMPLETED
99.4/ 100
METRIC RATING
74th/ 347
METRIC RANK
1.8%
NO SCHOOLING COMPLETED
99.2/ 100
METRIC RATING
87th/ 347
METRIC RANK
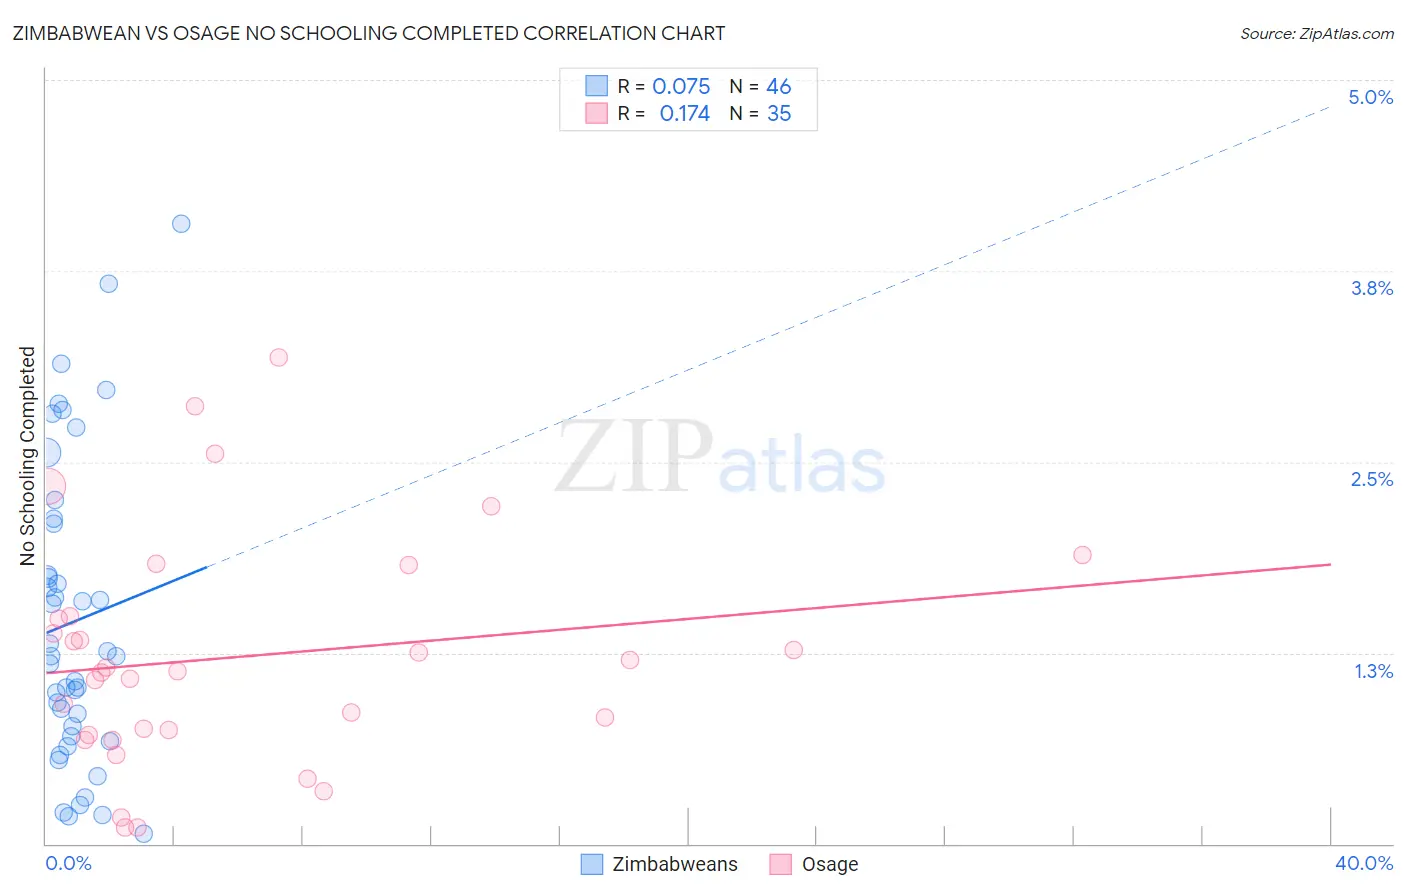
Zimbabwean vs Osage No Schooling Completed Correlation Chart
The statistical analysis conducted on geographies consisting of 69,120,863 people shows a slight positive correlation between the proportion of Zimbabweans and percentage of population with no schooling in the United States with a correlation coefficient (R) of 0.075 and weighted average of 1.7%. Similarly, the statistical analysis conducted on geographies consisting of 91,503,945 people shows a poor positive correlation between the proportion of Osage and percentage of population with no schooling in the United States with a correlation coefficient (R) of 0.174 and weighted average of 1.8%, a difference of 1.6%.
No Schooling Completed Correlation Summary
| Measurement | Zimbabwean | Osage |
| Minimum | 0.063% | 0.10% |
| Maximum | 4.1% | 3.2% |
| Range | 4.0% | 3.1% |
| Mean | 1.5% | 1.2% |
| Median | 1.2% | 1.1% |
| Interquartile 25% (IQ1) | 0.71% | 0.71% |
| Interquartile 75% (IQ3) | 2.1% | 1.5% |
| Interquartile Range (IQR) | 1.4% | 0.78% |
| Standard Deviation (Sample) | 0.99% | 0.75% |
| Standard Deviation (Population) | 0.98% | 0.74% |
Demographics Similar to Zimbabweans and Osage by No Schooling Completed
In terms of no schooling completed, the demographic groups most similar to Zimbabweans are Immigrants from India (1.7%, a difference of 0.020%), Cajun (1.7%, a difference of 0.50%), Immigrants from Belgium (1.7%, a difference of 0.58%), Cherokee (1.7%, a difference of 0.63%), and Immigrants from England (1.7%, a difference of 0.68%). Similarly, the demographic groups most similar to Osage are Immigrants from Western Europe (1.8%, a difference of 0.040%), South African (1.8%, a difference of 0.080%), Ukrainian (1.8%, a difference of 0.32%), Immigrants from Australia (1.7%, a difference of 0.37%), and Immigrants from Denmark (1.7%, a difference of 0.41%).
| Demographics | Rating | Rank | No Schooling Completed |
| Immigrants | Netherlands | 99.6 /100 | #70 | Exceptional 1.7% |
| Immigrants | England | 99.5 /100 | #71 | Exceptional 1.7% |
| Cajuns | 99.5 /100 | #72 | Exceptional 1.7% |
| Immigrants | India | 99.4 /100 | #73 | Exceptional 1.7% |
| Zimbabweans | 99.4 /100 | #74 | Exceptional 1.7% |
| Immigrants | Belgium | 99.3 /100 | #75 | Exceptional 1.7% |
| Cherokee | 99.3 /100 | #76 | Exceptional 1.7% |
| Immigrants | Sweden | 99.3 /100 | #77 | Exceptional 1.7% |
| Delaware | 99.3 /100 | #78 | Exceptional 1.7% |
| Macedonians | 99.3 /100 | #79 | Exceptional 1.7% |
| Cypriots | 99.3 /100 | #80 | Exceptional 1.7% |
| Icelanders | 99.3 /100 | #81 | Exceptional 1.7% |
| Immigrants | South Africa | 99.3 /100 | #82 | Exceptional 1.7% |
| Potawatomi | 99.3 /100 | #83 | Exceptional 1.7% |
| Immigrants | Denmark | 99.2 /100 | #84 | Exceptional 1.7% |
| Immigrants | Australia | 99.2 /100 | #85 | Exceptional 1.7% |
| Ukrainians | 99.2 /100 | #86 | Exceptional 1.8% |
| Osage | 99.2 /100 | #87 | Exceptional 1.8% |
| Immigrants | Western Europe | 99.2 /100 | #88 | Exceptional 1.8% |
| South Africans | 99.1 /100 | #89 | Exceptional 1.8% |
| Sioux | 99.0 /100 | #90 | Exceptional 1.8% |