Serbian vs Osage Male Poverty
COMPARE
Serbian
Osage
Male Poverty
Male Poverty Comparison
Serbians
Osage
10.2%
MALE POVERTY
97.5/ 100
METRIC RATING
66th/ 347
METRIC RANK
12.3%
MALE POVERTY
1.5/ 100
METRIC RATING
225th/ 347
METRIC RANK
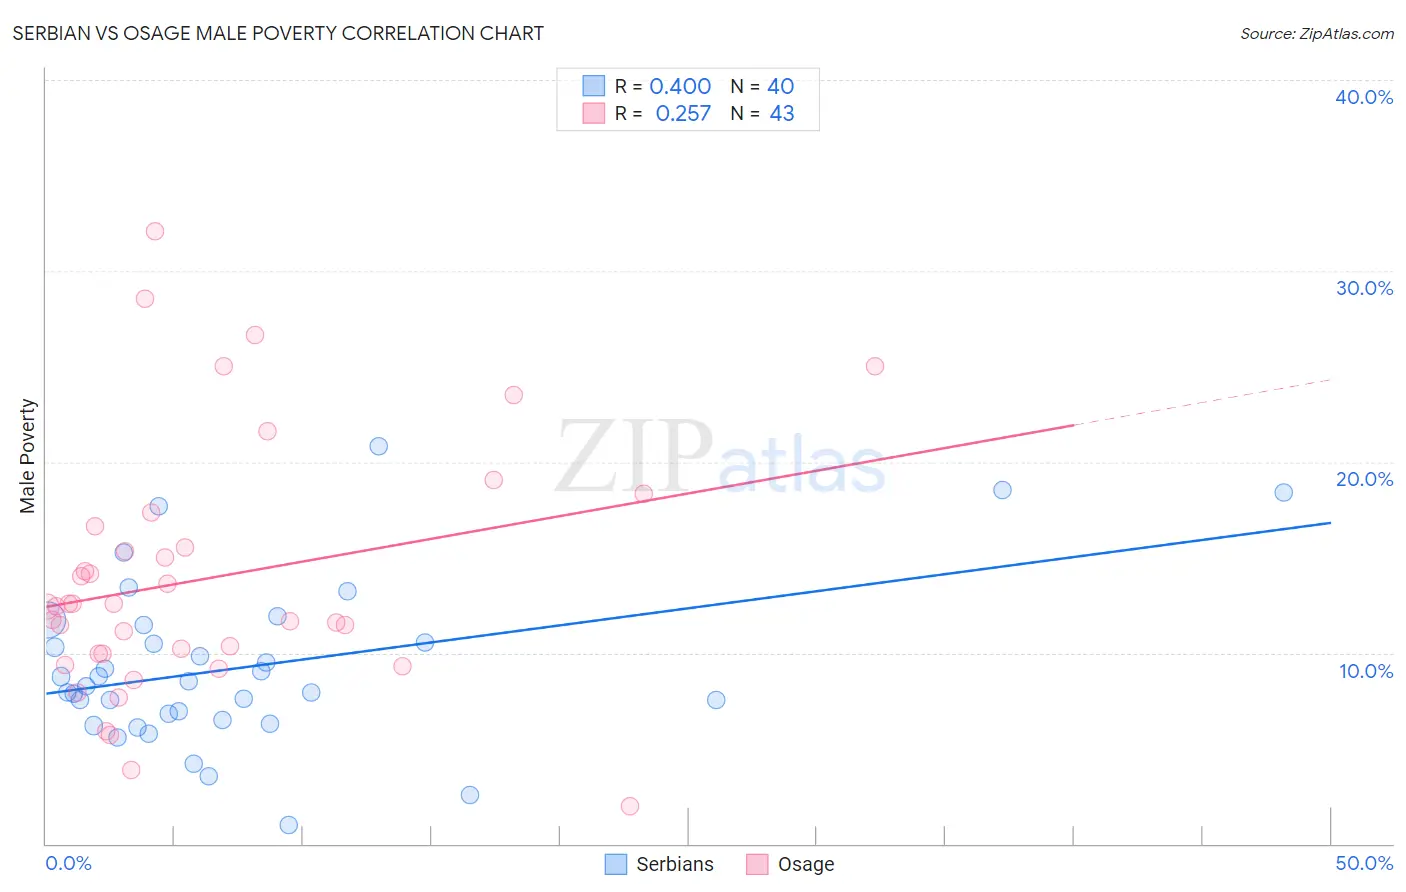
Serbian vs Osage Male Poverty Correlation Chart
The statistical analysis conducted on geographies consisting of 267,465,606 people shows a mild positive correlation between the proportion of Serbians and poverty level among males in the United States with a correlation coefficient (R) of 0.400 and weighted average of 10.2%. Similarly, the statistical analysis conducted on geographies consisting of 91,789,808 people shows a weak positive correlation between the proportion of Osage and poverty level among males in the United States with a correlation coefficient (R) of 0.257 and weighted average of 12.3%, a difference of 21.0%.
Male Poverty Correlation Summary
| Measurement | Serbian | Osage |
| Minimum | 1.0% | 1.9% |
| Maximum | 20.8% | 32.1% |
| Range | 19.8% | 30.2% |
| Mean | 9.3% | 13.9% |
| Median | 8.4% | 12.4% |
| Interquartile 25% (IQ1) | 6.6% | 9.9% |
| Interquartile 75% (IQ3) | 11.0% | 16.6% |
| Interquartile Range (IQR) | 4.4% | 6.7% |
| Standard Deviation (Sample) | 4.3% | 6.6% |
| Standard Deviation (Population) | 4.3% | 6.5% |
Similar Demographics by Male Poverty
Demographics Similar to Serbians by Male Poverty
In terms of male poverty, the demographic groups most similar to Serbians are Zimbabwean (10.2%, a difference of 0.010%), Swiss (10.2%, a difference of 0.080%), Immigrants from Netherlands (10.2%, a difference of 0.17%), Immigrants from Sri Lanka (10.2%, a difference of 0.22%), and Slovak (10.2%, a difference of 0.31%).
| Demographics | Rating | Rank | Male Poverty |
| Immigrants | Europe | 97.9 /100 | #59 | Exceptional 10.1% |
| Ukrainians | 97.9 /100 | #60 | Exceptional 10.1% |
| Austrians | 97.8 /100 | #61 | Exceptional 10.1% |
| Immigrants | Italy | 97.8 /100 | #62 | Exceptional 10.2% |
| Slovaks | 97.7 /100 | #63 | Exceptional 10.2% |
| Swiss | 97.5 /100 | #64 | Exceptional 10.2% |
| Zimbabweans | 97.5 /100 | #65 | Exceptional 10.2% |
| Serbians | 97.5 /100 | #66 | Exceptional 10.2% |
| Immigrants | Netherlands | 97.3 /100 | #67 | Exceptional 10.2% |
| Immigrants | Sri Lanka | 97.2 /100 | #68 | Exceptional 10.2% |
| Immigrants | Australia | 97.1 /100 | #69 | Exceptional 10.2% |
| Paraguayans | 97.1 /100 | #70 | Exceptional 10.2% |
| Europeans | 97.1 /100 | #71 | Exceptional 10.2% |
| Immigrants | Canada | 97.1 /100 | #72 | Exceptional 10.2% |
| Immigrants | Asia | 97.0 /100 | #73 | Exceptional 10.2% |
Demographics Similar to Osage by Male Poverty
In terms of male poverty, the demographic groups most similar to Osage are Immigrants from Nigeria (12.3%, a difference of 0.060%), Nigerian (12.3%, a difference of 0.17%), Alaska Native (12.4%, a difference of 0.26%), Alsatian (12.4%, a difference of 0.30%), and Cuban (12.4%, a difference of 0.39%).
| Demographics | Rating | Rank | Male Poverty |
| German Russians | 2.5 /100 | #218 | Tragic 12.2% |
| Bermudans | 2.4 /100 | #219 | Tragic 12.2% |
| Immigrants | Eritrea | 2.4 /100 | #220 | Tragic 12.2% |
| Ugandans | 2.2 /100 | #221 | Tragic 12.2% |
| Immigrants | Africa | 2.1 /100 | #222 | Tragic 12.2% |
| Immigrants | Micronesia | 2.1 /100 | #223 | Tragic 12.2% |
| Immigrants | Nigeria | 1.6 /100 | #224 | Tragic 12.3% |
| Osage | 1.5 /100 | #225 | Tragic 12.3% |
| Nigerians | 1.4 /100 | #226 | Tragic 12.3% |
| Alaska Natives | 1.4 /100 | #227 | Tragic 12.4% |
| Alsatians | 1.3 /100 | #228 | Tragic 12.4% |
| Cubans | 1.3 /100 | #229 | Tragic 12.4% |
| Marshallese | 0.8 /100 | #230 | Tragic 12.5% |
| Salvadorans | 0.6 /100 | #231 | Tragic 12.6% |
| Nicaraguans | 0.6 /100 | #232 | Tragic 12.6% |