Fijian vs Immigrants from Portugal Single Father Poverty
COMPARE
Fijian
Immigrants from Portugal
Single Father Poverty
Single Father Poverty Comparison
Fijians
Immigrants from Portugal
15.7%
SINGLE FATHER POVERTY
96.8/ 100
METRIC RATING
101st/ 347
METRIC RANK
15.9%
SINGLE FATHER POVERTY
89.7/ 100
METRIC RATING
132nd/ 347
METRIC RANK
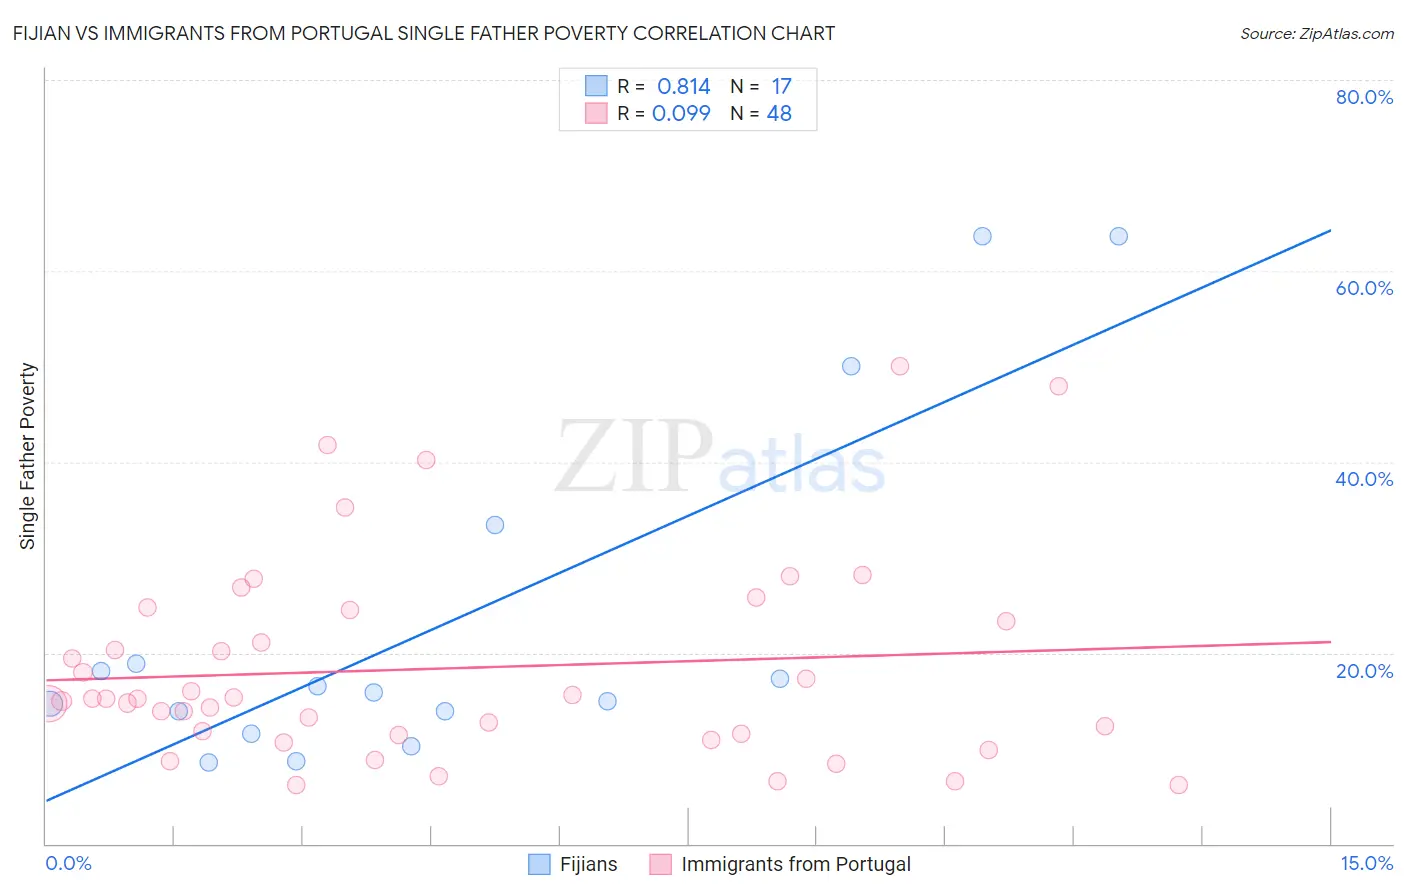
Fijian vs Immigrants from Portugal Single Father Poverty Correlation Chart
The statistical analysis conducted on geographies consisting of 52,243,042 people shows a very strong positive correlation between the proportion of Fijians and poverty level among single fathers in the United States with a correlation coefficient (R) of 0.814 and weighted average of 15.7%. Similarly, the statistical analysis conducted on geographies consisting of 145,028,103 people shows a slight positive correlation between the proportion of Immigrants from Portugal and poverty level among single fathers in the United States with a correlation coefficient (R) of 0.099 and weighted average of 15.9%, a difference of 1.5%.
Single Father Poverty Correlation Summary
| Measurement | Fijian | Immigrants from Portugal |
| Minimum | 8.5% | 6.1% |
| Maximum | 63.6% | 50.0% |
| Range | 55.2% | 43.9% |
| Mean | 23.1% | 18.4% |
| Median | 15.9% | 15.2% |
| Interquartile 25% (IQ1) | 12.7% | 11.4% |
| Interquartile 75% (IQ3) | 26.1% | 23.9% |
| Interquartile Range (IQR) | 13.4% | 12.5% |
| Standard Deviation (Sample) | 18.2% | 10.6% |
| Standard Deviation (Population) | 17.7% | 10.5% |
Similar Demographics by Single Father Poverty
Demographics Similar to Fijians by Single Father Poverty
In terms of single father poverty, the demographic groups most similar to Fijians are Immigrants from Chile (15.7%, a difference of 0.030%), Chilean (15.7%, a difference of 0.16%), South American Indian (15.7%, a difference of 0.22%), Australian (15.7%, a difference of 0.24%), and Immigrants from Middle Africa (15.6%, a difference of 0.25%).
| Demographics | Rating | Rank | Single Father Poverty |
| Immigrants | Uruguay | 98.2 /100 | #94 | Exceptional 15.6% |
| Immigrants | Kazakhstan | 98.2 /100 | #95 | Exceptional 15.6% |
| Immigrants | Belgium | 98.1 /100 | #96 | Exceptional 15.6% |
| Yaqui | 98.1 /100 | #97 | Exceptional 15.6% |
| Zimbabweans | 98.1 /100 | #98 | Exceptional 15.6% |
| Immigrants | Middle Africa | 97.4 /100 | #99 | Exceptional 15.6% |
| Immigrants | Chile | 96.9 /100 | #100 | Exceptional 15.7% |
| Fijians | 96.8 /100 | #101 | Exceptional 15.7% |
| Chileans | 96.4 /100 | #102 | Exceptional 15.7% |
| South American Indians | 96.2 /100 | #103 | Exceptional 15.7% |
| Australians | 96.1 /100 | #104 | Exceptional 15.7% |
| Immigrants | Australia | 96.1 /100 | #105 | Exceptional 15.7% |
| Immigrants | Poland | 95.8 /100 | #106 | Exceptional 15.7% |
| Native Hawaiians | 95.8 /100 | #107 | Exceptional 15.7% |
| Pakistanis | 95.7 /100 | #108 | Exceptional 15.7% |
Demographics Similar to Immigrants from Portugal by Single Father Poverty
In terms of single father poverty, the demographic groups most similar to Immigrants from Portugal are Immigrants from Syria (15.9%, a difference of 0.020%), Norwegian (15.9%, a difference of 0.060%), Nicaraguan (15.9%, a difference of 0.060%), Immigrants from West Indies (15.9%, a difference of 0.14%), and Immigrants from South America (15.9%, a difference of 0.14%).
| Demographics | Rating | Rank | Single Father Poverty |
| Iraqis | 91.2 /100 | #125 | Exceptional 15.9% |
| Hmong | 91.1 /100 | #126 | Exceptional 15.9% |
| Immigrants | Liberia | 91.1 /100 | #127 | Exceptional 15.9% |
| Immigrants | Nigeria | 90.8 /100 | #128 | Exceptional 15.9% |
| Immigrants | West Indies | 90.8 /100 | #129 | Exceptional 15.9% |
| Norwegians | 90.2 /100 | #130 | Exceptional 15.9% |
| Nicaraguans | 90.1 /100 | #131 | Exceptional 15.9% |
| Immigrants | Portugal | 89.7 /100 | #132 | Excellent 15.9% |
| Immigrants | Syria | 89.5 /100 | #133 | Excellent 15.9% |
| Immigrants | South America | 88.5 /100 | #134 | Excellent 15.9% |
| Immigrants | Sri Lanka | 88.2 /100 | #135 | Excellent 15.9% |
| Cypriots | 87.5 /100 | #136 | Excellent 15.9% |
| Immigrants | Azores | 87.2 /100 | #137 | Excellent 15.9% |
| Central Americans | 87.1 /100 | #138 | Excellent 16.0% |
| South Americans | 85.9 /100 | #139 | Excellent 16.0% |