Austrian vs Immigrants from Portugal Single Father Poverty
COMPARE
Austrian
Immigrants from Portugal
Single Father Poverty
Single Father Poverty Comparison
Austrians
Immigrants from Portugal
17.1%
SINGLE FATHER POVERTY
1.1/ 100
METRIC RATING
250th/ 347
METRIC RANK
15.9%
SINGLE FATHER POVERTY
89.7/ 100
METRIC RATING
132nd/ 347
METRIC RANK
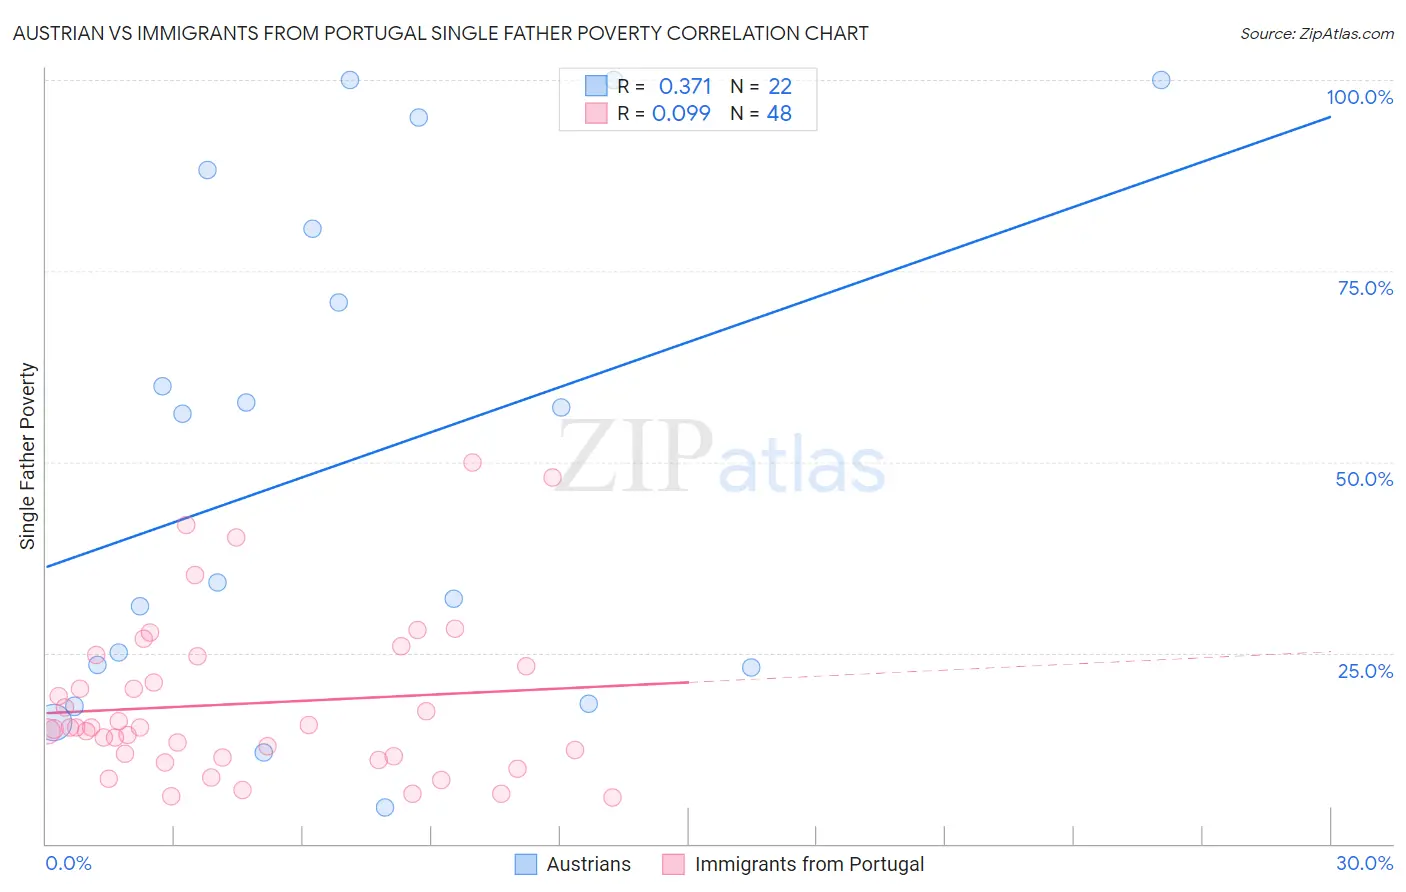
Austrian vs Immigrants from Portugal Single Father Poverty Correlation Chart
The statistical analysis conducted on geographies consisting of 340,326,838 people shows a mild positive correlation between the proportion of Austrians and poverty level among single fathers in the United States with a correlation coefficient (R) of 0.371 and weighted average of 17.1%. Similarly, the statistical analysis conducted on geographies consisting of 145,028,103 people shows a slight positive correlation between the proportion of Immigrants from Portugal and poverty level among single fathers in the United States with a correlation coefficient (R) of 0.099 and weighted average of 15.9%, a difference of 7.5%.
Single Father Poverty Correlation Summary
| Measurement | Austrian | Immigrants from Portugal |
| Minimum | 4.8% | 6.1% |
| Maximum | 100.0% | 50.0% |
| Range | 95.2% | 43.9% |
| Mean | 50.2% | 18.4% |
| Median | 45.2% | 15.2% |
| Interquartile 25% (IQ1) | 23.1% | 11.4% |
| Interquartile 75% (IQ3) | 80.6% | 23.9% |
| Interquartile Range (IQR) | 57.5% | 12.5% |
| Standard Deviation (Sample) | 32.6% | 10.6% |
| Standard Deviation (Population) | 31.8% | 10.5% |
Similar Demographics by Single Father Poverty
Demographics Similar to Austrians by Single Father Poverty
In terms of single father poverty, the demographic groups most similar to Austrians are Luxembourger (17.1%, a difference of 0.010%), Croatian (17.1%, a difference of 0.11%), Cree (17.1%, a difference of 0.11%), Canadian (17.1%, a difference of 0.13%), and Czechoslovakian (17.1%, a difference of 0.17%).
| Demographics | Rating | Rank | Single Father Poverty |
| Immigrants | Cabo Verde | 1.6 /100 | #243 | Tragic 17.0% |
| Hondurans | 1.6 /100 | #244 | Tragic 17.0% |
| Trinidadians and Tobagonians | 1.5 /100 | #245 | Tragic 17.0% |
| Immigrants | Ireland | 1.4 /100 | #246 | Tragic 17.1% |
| Greeks | 1.3 /100 | #247 | Tragic 17.1% |
| Czechoslovakians | 1.3 /100 | #248 | Tragic 17.1% |
| Canadians | 1.3 /100 | #249 | Tragic 17.1% |
| Austrians | 1.1 /100 | #250 | Tragic 17.1% |
| Luxembourgers | 1.1 /100 | #251 | Tragic 17.1% |
| Croatians | 1.0 /100 | #252 | Tragic 17.1% |
| Cree | 1.0 /100 | #253 | Tragic 17.1% |
| Immigrants | Honduras | 0.9 /100 | #254 | Tragic 17.1% |
| Sierra Leoneans | 0.8 /100 | #255 | Tragic 17.2% |
| Immigrants | Haiti | 0.8 /100 | #256 | Tragic 17.2% |
| Immigrants | Albania | 0.7 /100 | #257 | Tragic 17.2% |
Demographics Similar to Immigrants from Portugal by Single Father Poverty
In terms of single father poverty, the demographic groups most similar to Immigrants from Portugal are Immigrants from Syria (15.9%, a difference of 0.020%), Norwegian (15.9%, a difference of 0.060%), Nicaraguan (15.9%, a difference of 0.060%), Immigrants from West Indies (15.9%, a difference of 0.14%), and Immigrants from South America (15.9%, a difference of 0.14%).
| Demographics | Rating | Rank | Single Father Poverty |
| Iraqis | 91.2 /100 | #125 | Exceptional 15.9% |
| Hmong | 91.1 /100 | #126 | Exceptional 15.9% |
| Immigrants | Liberia | 91.1 /100 | #127 | Exceptional 15.9% |
| Immigrants | Nigeria | 90.8 /100 | #128 | Exceptional 15.9% |
| Immigrants | West Indies | 90.8 /100 | #129 | Exceptional 15.9% |
| Norwegians | 90.2 /100 | #130 | Exceptional 15.9% |
| Nicaraguans | 90.1 /100 | #131 | Exceptional 15.9% |
| Immigrants | Portugal | 89.7 /100 | #132 | Excellent 15.9% |
| Immigrants | Syria | 89.5 /100 | #133 | Excellent 15.9% |
| Immigrants | South America | 88.5 /100 | #134 | Excellent 15.9% |
| Immigrants | Sri Lanka | 88.2 /100 | #135 | Excellent 15.9% |
| Cypriots | 87.5 /100 | #136 | Excellent 15.9% |
| Immigrants | Azores | 87.2 /100 | #137 | Excellent 15.9% |
| Central Americans | 87.1 /100 | #138 | Excellent 16.0% |
| South Americans | 85.9 /100 | #139 | Excellent 16.0% |