Zimbabwean vs Hawaiian Single Male Poverty
COMPARE
Zimbabwean
Hawaiian
Single Male Poverty
Single Male Poverty Comparison
Zimbabweans
Hawaiians
13.1%
SINGLE MALE POVERTY
14.9/ 100
METRIC RATING
214th/ 347
METRIC RANK
12.6%
SINGLE MALE POVERTY
75.1/ 100
METRIC RATING
144th/ 347
METRIC RANK
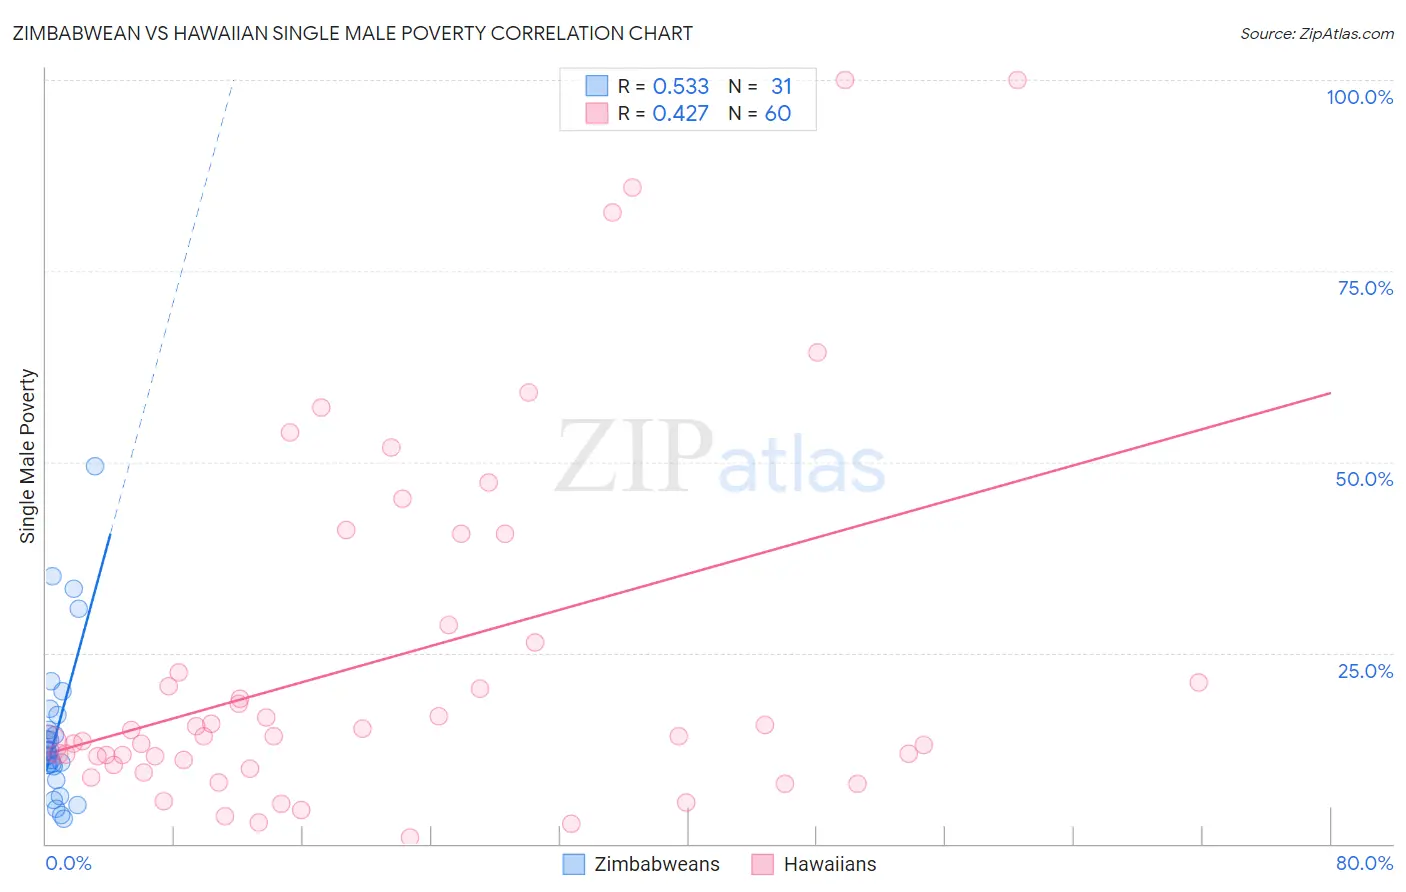
Zimbabwean vs Hawaiian Single Male Poverty Correlation Chart
The statistical analysis conducted on geographies consisting of 66,821,414 people shows a substantial positive correlation between the proportion of Zimbabweans and poverty level among single males in the United States with a correlation coefficient (R) of 0.533 and weighted average of 13.1%. Similarly, the statistical analysis conducted on geographies consisting of 300,272,441 people shows a moderate positive correlation between the proportion of Hawaiians and poverty level among single males in the United States with a correlation coefficient (R) of 0.427 and weighted average of 12.6%, a difference of 3.8%.
Single Male Poverty Correlation Summary
| Measurement | Zimbabwean | Hawaiian |
| Minimum | 3.2% | 0.75% |
| Maximum | 49.4% | 100.0% |
| Range | 46.2% | 99.3% |
| Mean | 14.7% | 24.1% |
| Median | 12.2% | 14.1% |
| Interquartile 25% (IQ1) | 10.2% | 10.7% |
| Interquartile 75% (IQ3) | 16.9% | 27.4% |
| Interquartile Range (IQR) | 6.7% | 16.7% |
| Standard Deviation (Sample) | 10.2% | 24.0% |
| Standard Deviation (Population) | 10.0% | 23.8% |
Similar Demographics by Single Male Poverty
Demographics Similar to Zimbabweans by Single Male Poverty
In terms of single male poverty, the demographic groups most similar to Zimbabweans are Japanese (13.1%, a difference of 0.010%), Italian (13.1%, a difference of 0.090%), Austrian (13.1%, a difference of 0.10%), Senegalese (13.1%, a difference of 0.15%), and Swedish (13.1%, a difference of 0.18%).
| Demographics | Rating | Rank | Single Male Poverty |
| Sudanese | 17.7 /100 | #207 | Poor 13.1% |
| Immigrants | Western Africa | 17.6 /100 | #208 | Poor 13.1% |
| Mexican American Indians | 17.5 /100 | #209 | Poor 13.1% |
| Immigrants | Haiti | 16.8 /100 | #210 | Poor 13.1% |
| Swedes | 16.8 /100 | #211 | Poor 13.1% |
| Senegalese | 16.4 /100 | #212 | Poor 13.1% |
| Italians | 15.9 /100 | #213 | Poor 13.1% |
| Zimbabweans | 14.9 /100 | #214 | Poor 13.1% |
| Japanese | 14.8 /100 | #215 | Poor 13.1% |
| Austrians | 13.9 /100 | #216 | Poor 13.1% |
| Bermudans | 13.0 /100 | #217 | Poor 13.1% |
| Scandinavians | 12.9 /100 | #218 | Poor 13.1% |
| Immigrants | Burma/Myanmar | 12.6 /100 | #219 | Poor 13.1% |
| Central Americans | 10.9 /100 | #220 | Poor 13.2% |
| New Zealanders | 10.7 /100 | #221 | Poor 13.2% |
Demographics Similar to Hawaiians by Single Male Poverty
In terms of single male poverty, the demographic groups most similar to Hawaiians are Immigrants from Lebanon (12.6%, a difference of 0.010%), Native Hawaiian (12.6%, a difference of 0.010%), Malaysian (12.6%, a difference of 0.020%), Immigrants from France (12.6%, a difference of 0.050%), and Okinawan (12.6%, a difference of 0.060%).
| Demographics | Rating | Rank | Single Male Poverty |
| Ukrainians | 80.7 /100 | #137 | Excellent 12.6% |
| Immigrants | El Salvador | 80.0 /100 | #138 | Excellent 12.6% |
| Cubans | 79.9 /100 | #139 | Good 12.6% |
| Immigrants | Zimbabwe | 78.0 /100 | #140 | Good 12.6% |
| Okinawans | 75.9 /100 | #141 | Good 12.6% |
| Immigrants | Uganda | 75.9 /100 | #142 | Good 12.6% |
| Immigrants | France | 75.8 /100 | #143 | Good 12.6% |
| Hawaiians | 75.1 /100 | #144 | Good 12.6% |
| Immigrants | Lebanon | 75.0 /100 | #145 | Good 12.6% |
| Native Hawaiians | 75.0 /100 | #146 | Good 12.6% |
| Malaysians | 74.8 /100 | #147 | Good 12.6% |
| Yugoslavians | 73.9 /100 | #148 | Good 12.6% |
| Sierra Leoneans | 73.0 /100 | #149 | Good 12.6% |
| Immigrants | Panama | 72.1 /100 | #150 | Good 12.6% |
| Immigrants | Hungary | 71.9 /100 | #151 | Good 12.6% |