Immigrants from Moldova vs Immigrants from Chile Poverty
COMPARE
Immigrants from Moldova
Immigrants from Chile
Poverty
Poverty Comparison
Immigrants from Moldova
Immigrants from Chile
10.9%
POVERTY
99.1/ 100
METRIC RATING
44th/ 347
METRIC RANK
12.2%
POVERTY
56.7/ 100
METRIC RATING
167th/ 347
METRIC RANK
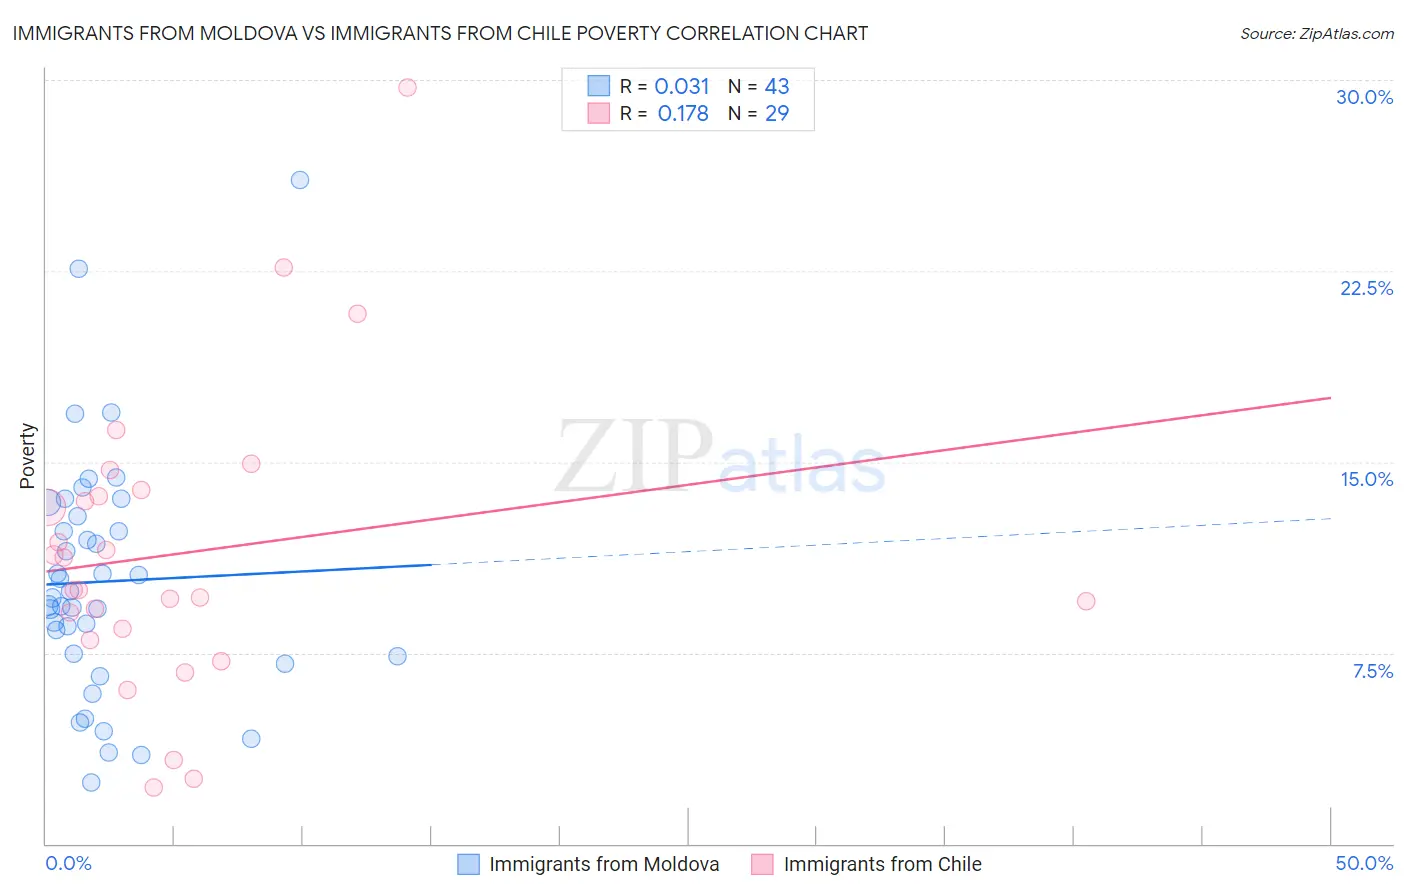
Immigrants from Moldova vs Immigrants from Chile Poverty Correlation Chart
The statistical analysis conducted on geographies consisting of 124,373,713 people shows no correlation between the proportion of Immigrants from Moldova and poverty level in the United States with a correlation coefficient (R) of 0.031 and weighted average of 10.9%. Similarly, the statistical analysis conducted on geographies consisting of 218,605,054 people shows a poor positive correlation between the proportion of Immigrants from Chile and poverty level in the United States with a correlation coefficient (R) of 0.178 and weighted average of 12.2%, a difference of 12.2%.
Poverty Correlation Summary
| Measurement | Immigrants from Moldova | Immigrants from Chile |
| Minimum | 2.4% | 2.2% |
| Maximum | 26.1% | 29.7% |
| Range | 23.7% | 27.5% |
| Mean | 10.3% | 11.4% |
| Median | 9.7% | 10.0% |
| Interquartile 25% (IQ1) | 7.4% | 8.2% |
| Interquartile 75% (IQ3) | 12.9% | 13.8% |
| Interquartile Range (IQR) | 5.5% | 5.6% |
| Standard Deviation (Sample) | 4.8% | 5.8% |
| Standard Deviation (Population) | 4.7% | 5.7% |
Similar Demographics by Poverty
Demographics Similar to Immigrants from Moldova by Poverty
In terms of poverty, the demographic groups most similar to Immigrants from Moldova are Immigrants from Singapore (10.9%, a difference of 0.14%), Korean (10.9%, a difference of 0.19%), Immigrants from Iran (10.9%, a difference of 0.41%), Russian (10.9%, a difference of 0.50%), and Turkish (11.0%, a difference of 0.51%).
| Demographics | Rating | Rank | Poverty |
| Immigrants | Greece | 99.3 /100 | #37 | Exceptional 10.8% |
| Czechs | 99.3 /100 | #38 | Exceptional 10.8% |
| Immigrants | Pakistan | 99.3 /100 | #39 | Exceptional 10.8% |
| Russians | 99.3 /100 | #40 | Exceptional 10.9% |
| Immigrants | Iran | 99.2 /100 | #41 | Exceptional 10.9% |
| Koreans | 99.2 /100 | #42 | Exceptional 10.9% |
| Immigrants | Singapore | 99.2 /100 | #43 | Exceptional 10.9% |
| Immigrants | Moldova | 99.1 /100 | #44 | Exceptional 10.9% |
| Turks | 98.9 /100 | #45 | Exceptional 11.0% |
| Immigrants | Czechoslovakia | 98.9 /100 | #46 | Exceptional 11.0% |
| Immigrants | Romania | 98.9 /100 | #47 | Exceptional 11.0% |
| Slovenes | 98.9 /100 | #48 | Exceptional 11.0% |
| Immigrants | Japan | 98.9 /100 | #49 | Exceptional 11.0% |
| Asians | 98.9 /100 | #50 | Exceptional 11.0% |
| Immigrants | Croatia | 98.7 /100 | #51 | Exceptional 11.0% |
Demographics Similar to Immigrants from Chile by Poverty
In terms of poverty, the demographic groups most similar to Immigrants from Chile are Venezuelan (12.2%, a difference of 0.020%), Immigrants from Venezuela (12.2%, a difference of 0.020%), Colombian (12.2%, a difference of 0.11%), Immigrants from Albania (12.2%, a difference of 0.11%), and White/Caucasian (12.3%, a difference of 0.13%).
| Demographics | Rating | Rank | Poverty |
| Immigrants | Nepal | 60.4 /100 | #160 | Good 12.2% |
| Immigrants | Fiji | 59.1 /100 | #161 | Average 12.2% |
| Ethiopians | 59.1 /100 | #162 | Average 12.2% |
| Immigrants | Ethiopia | 58.6 /100 | #163 | Average 12.2% |
| Colombians | 57.8 /100 | #164 | Average 12.2% |
| Immigrants | Albania | 57.7 /100 | #165 | Average 12.2% |
| Venezuelans | 56.9 /100 | #166 | Average 12.2% |
| Immigrants | Chile | 56.7 /100 | #167 | Average 12.2% |
| Immigrants | Venezuela | 56.5 /100 | #168 | Average 12.2% |
| Whites/Caucasians | 55.4 /100 | #169 | Average 12.3% |
| Immigrants | Oceania | 54.6 /100 | #170 | Average 12.3% |
| Immigrants | Spain | 51.3 /100 | #171 | Average 12.3% |
| Immigrants | Portugal | 50.5 /100 | #172 | Average 12.3% |
| Celtics | 50.1 /100 | #173 | Average 12.3% |
| Lebanese | 50.0 /100 | #174 | Average 12.3% |